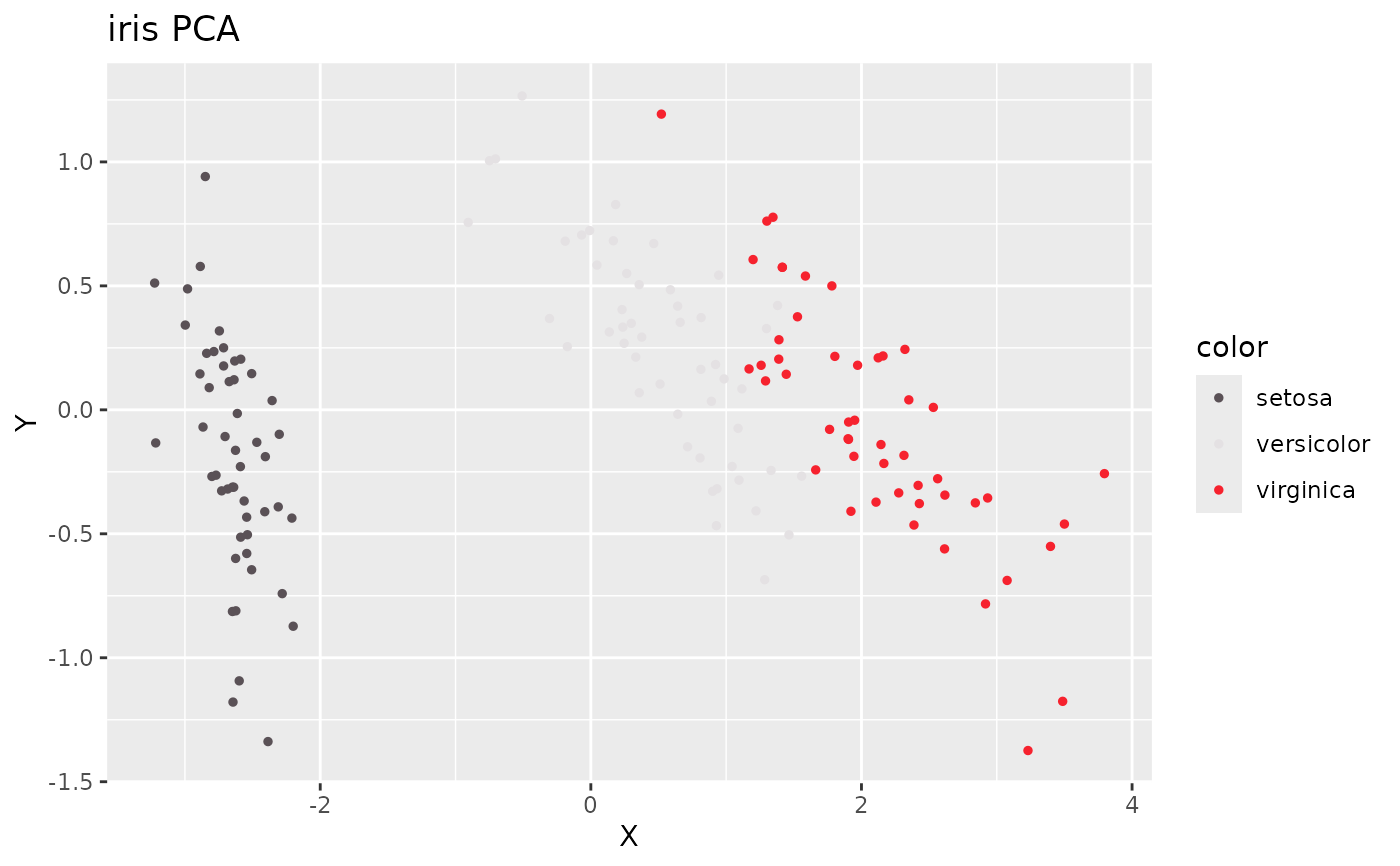
Plots embedded coordinates with ggplot2 and returns an ordinary ggplot object, so callers can add their own themes, annotations, guides, or other ggplot layers.
Usage
embed_ggplot(
  coords,
  x = NULL,
  colors = NULL,
  color_scheme = NULL,
  num_colors = 15,
  alpha_scale = 1,
  limits = NULL,
  top = NULL,
  cex = 1,
  title = NULL,
  text = NULL,
  sub = NULL,
  equal_axes = FALSE,
  pc_axes = FALSE,
  xlim = NULL,
  ylim = NULL,
  show_axes = TRUE,
  NA_color = NULL,
  rev = FALSE,
  verbose = FALSE
)
Arguments
- coords
Matrix of embedded coordinates, with as many rows as observations, and 2 columns.
- x
Either a data frame or a column that can be used to derive a suitable vector of colors. Ignored if
colorsis provided.- colors
A single color or one color per observation.
- color_scheme
A color scheme. See Details. Ignored if
colorsis specified.- num_colors
Number of distinct colors to use in the palette, when
xis a numeric vector, on the assumption that the palette is continuous (which it probably should be). Ignored ifxis not a numeric vector. If set toNULL, it will be set tolength(x).- alpha_scale
Scale the opacity alpha of the colors, between 0 and 1. Useful for increasing the transparency of points, especially with large plots with lots of overlap.
- limits
The range that the colors should map over when mapping from a numeric vector. If not specified, then the range of
x. This is useful if there is some external absolute scale that should be used. Ignored ifxis not a numeric vector.- top
If not
NULL, only this many finite values from a directly supplied numericxare displayed. Values are selected in decreasing order with existing row order breaking ties.- cex
Size passed to the ggplot2 point or text layer.
- title
Title for the plot.
- text
Vector of label text to display instead of a point. If the labels are long or the data set is large, this is unlikely to be very legible, but is occasionally useful.
- sub
Subtitle for the plot. Appears below the title.
- equal_axes
If
TRUE, use a common coordinate range and equal physical units on the X and Y axes.- pc_axes
If
TRUE, thecoordsare replaced by the first two (unscaled) principal components, which should have the effect of rotating the data (with a potential reflection) so the main variance aligns along the X-axis. Should not have any other scaling effect.- xlim
Vector of two numeric values to give the numeric extent of the X-axis after any PCA rotation. Ignored if
equal_axes = TRUE.- ylim
Vector of two numeric values to give the numeric extent of the Y-axis after any PCA rotation. Ignored if
equal_axes = TRUE.- show_axes
If
TRUE, the axes, axis labels (and frame) are displayed.- NA_color
Color to use for
NAvalues, which can arise if using a factor column forx(or if any item incolorsisNA). By default, these points won't be displayed.- rev
Logical indicating whether generated palettes or continuous scales should be reversed. Explicit
colorsare unchanged.- verbose
If
TRUE, log messages to the console, mainly when searching for a suitable color column in a dataframe.
Details
This is a small ggplot2 renderer for the same resolved coordinates and color
semantics as embed_plot(). It uses native ggplot2 discrete, continuous,
and identity scales. ggplot2 is an optional dependency and must be installed
to use this function.
Examples
pca_iris <- stats::prcomp(iris[, -5], retx = TRUE, rank. = 2)
embed_ggplot(pca_iris$x, iris$Species, title = "iris PCA")