This article retains its original experiments and examples. For current package usage, see the usage guide.
This a companion to the experiments I did with UMAP. Here I’m going to see if borrowing some of UMAP’s way of doing things affects t-SNE performance measurably. See the previous UMAP page and the theory for details on UMAP. This work was inspired by the release of the UMAP paper, which shows a very nice result for the COIL-20 data with UMAP. As of this writing, the settings used for that result were not available, so this is an attempt to see if there’s something specific to one of the differences of UMAP from t-SNE that causes that difference, e.g. the method of generating the input our output weights. If so, perhaps t-SNE could produce a result nearly as good, just by borrowing that feature.
By borrowing individual changes from UMAP we can define some new versions of t-SNE:
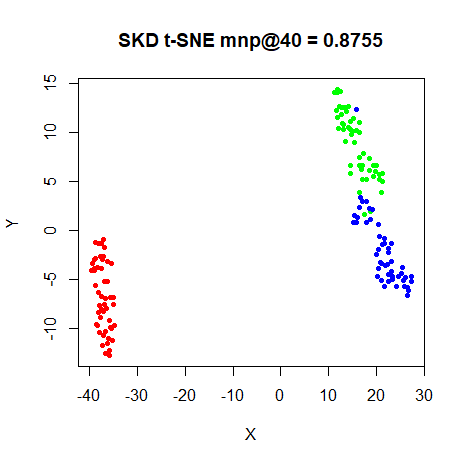
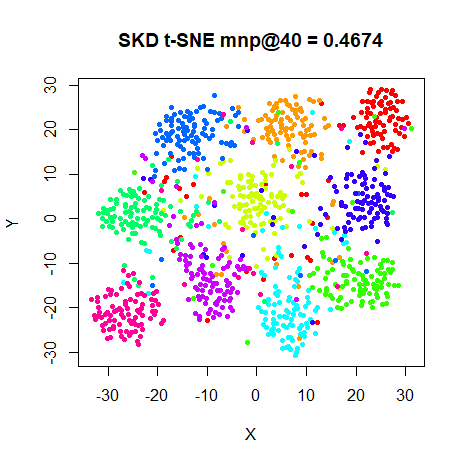
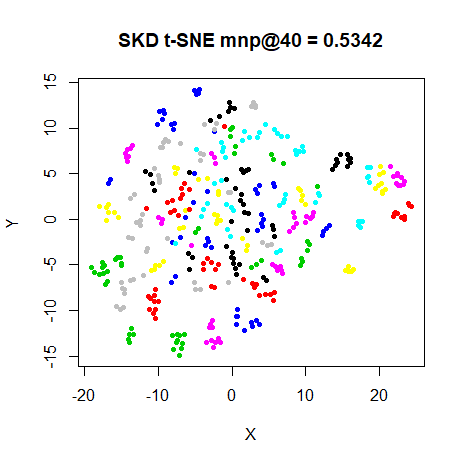
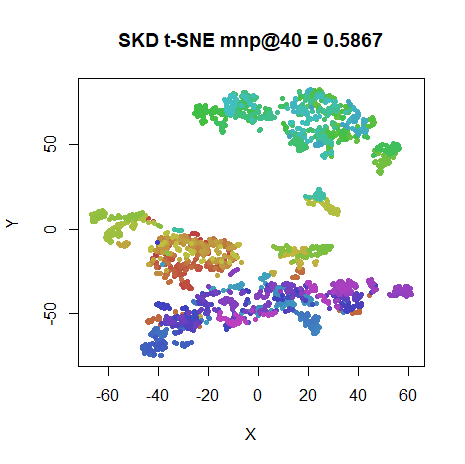
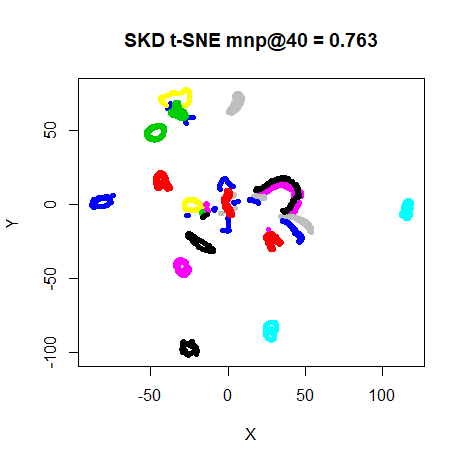
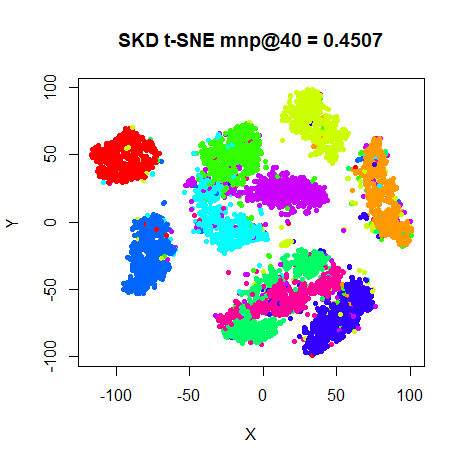
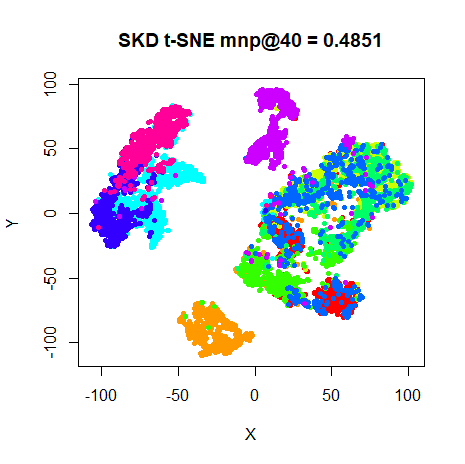
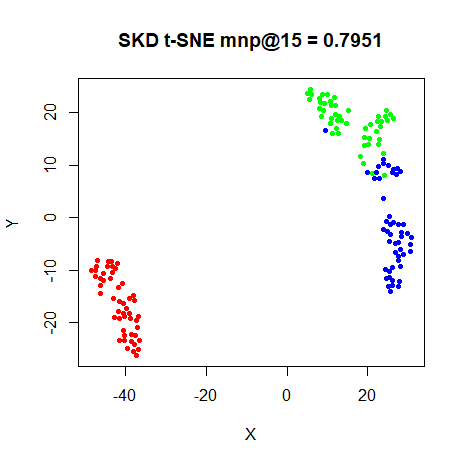
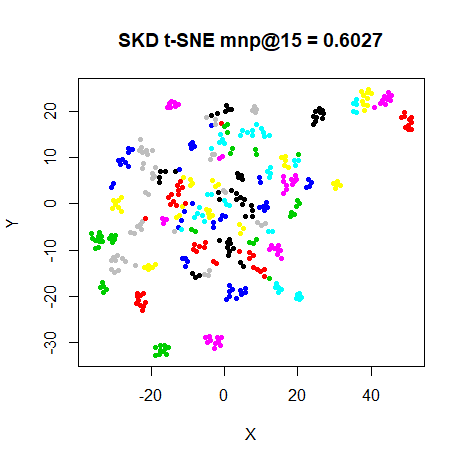
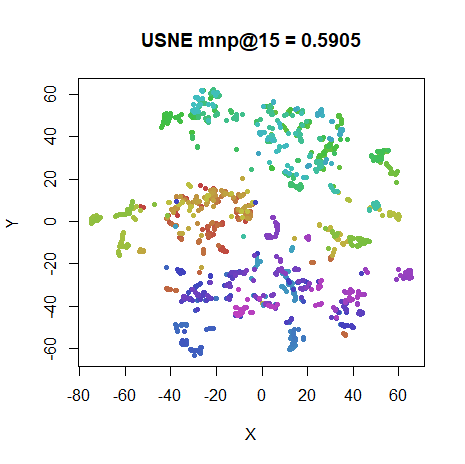
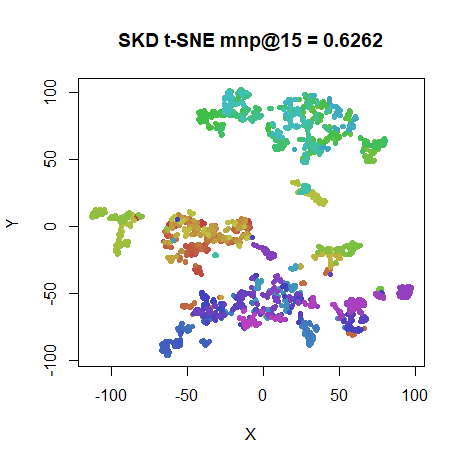
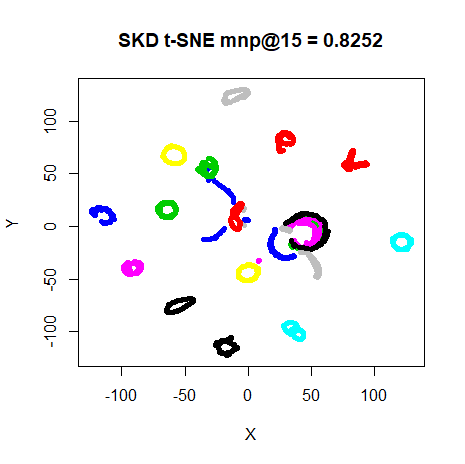
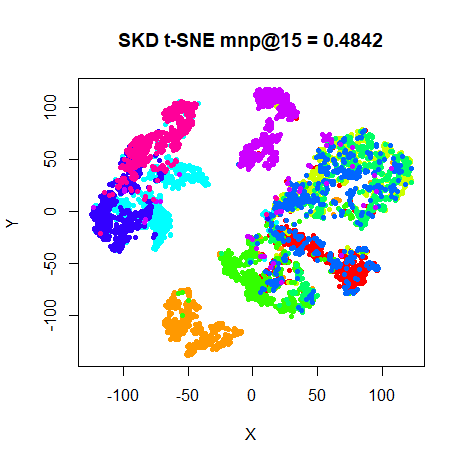
- SKD t-SNE: Instead of a perplexity-based calibration to generate the input weights, it uses smooth knn distances.
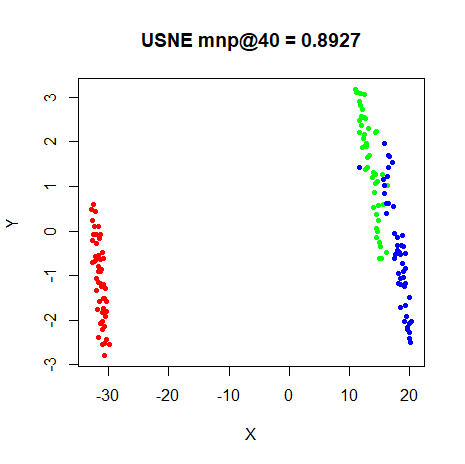
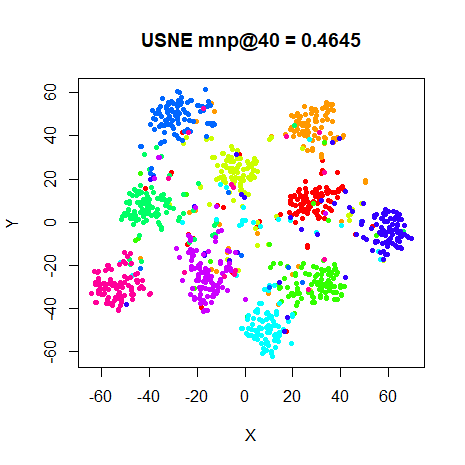
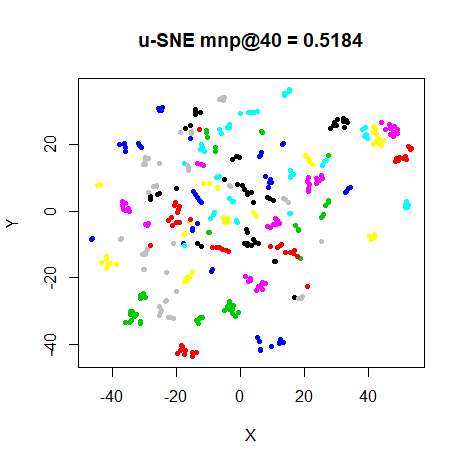
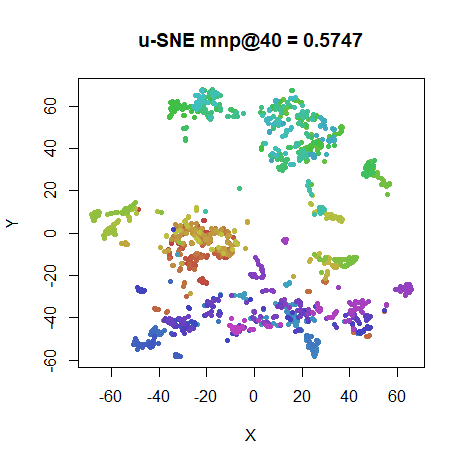
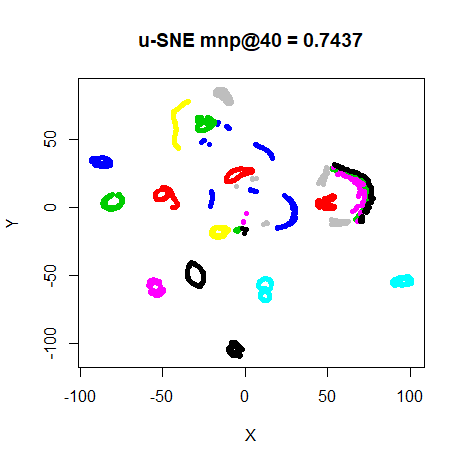
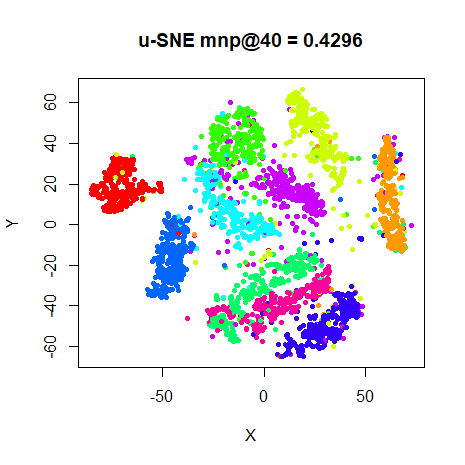
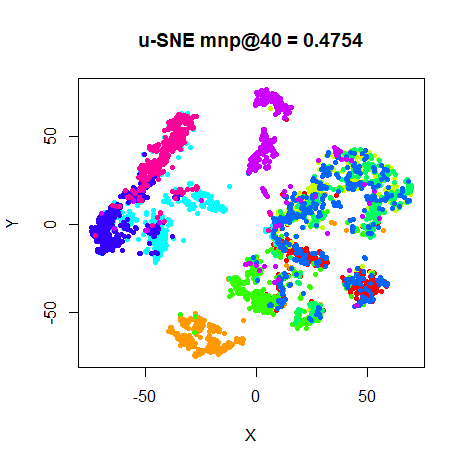
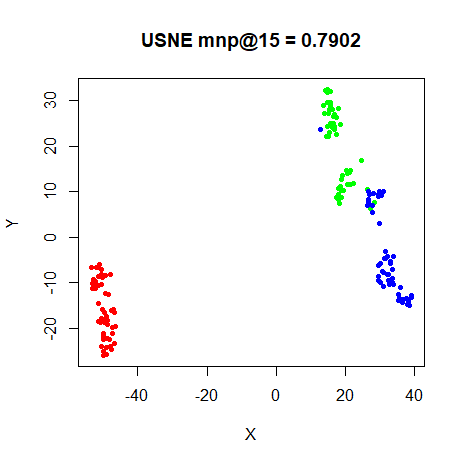
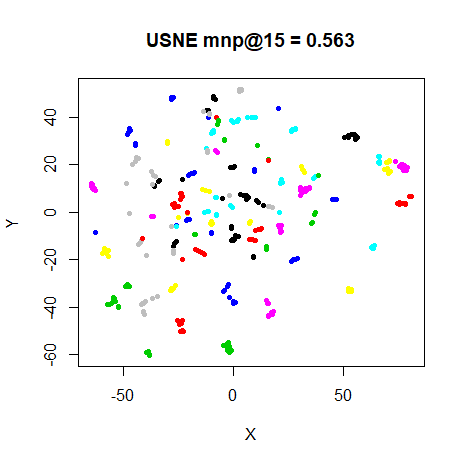
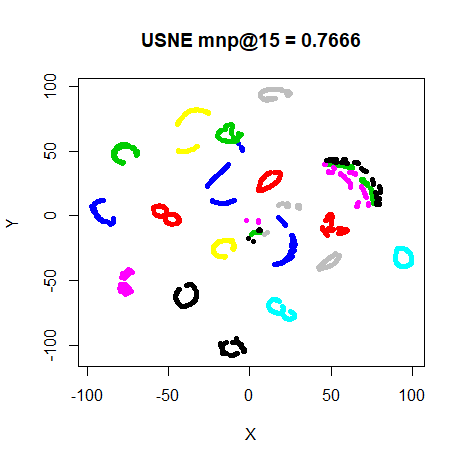
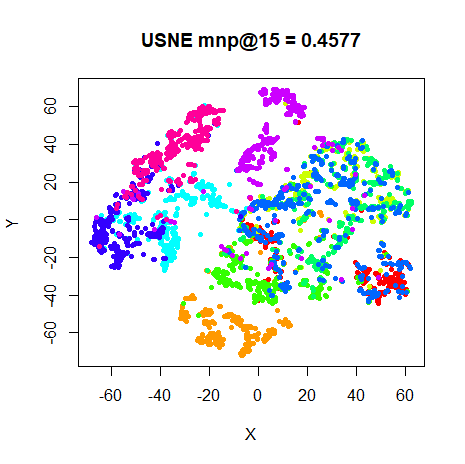
- u-SNE: Instead of the t-distribution to define the output kernel,
the UMAP function is w_{ij} = 1 / \left(1 +
ad_{ij}^{2b}\right). When using a function like this, both
LargeVis and UMAP add a value between
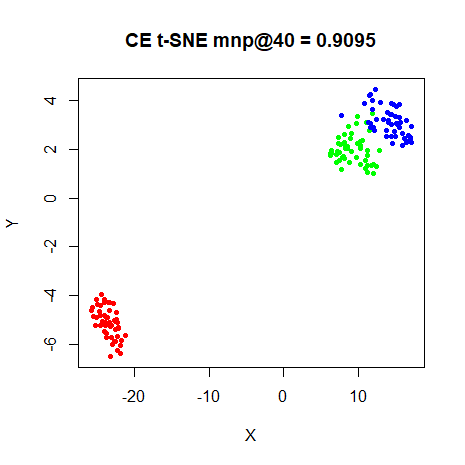
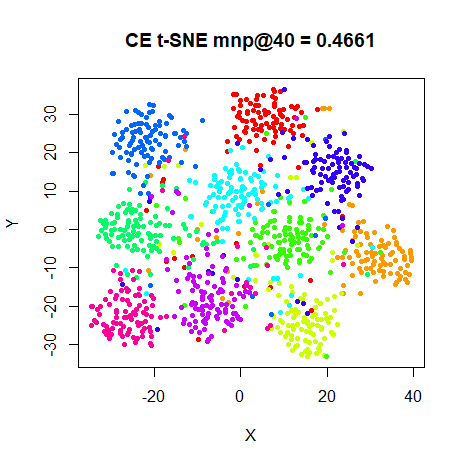
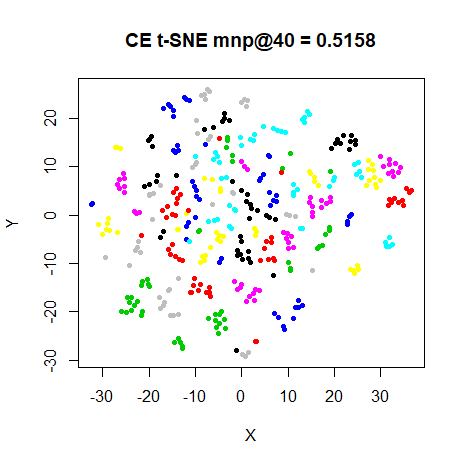
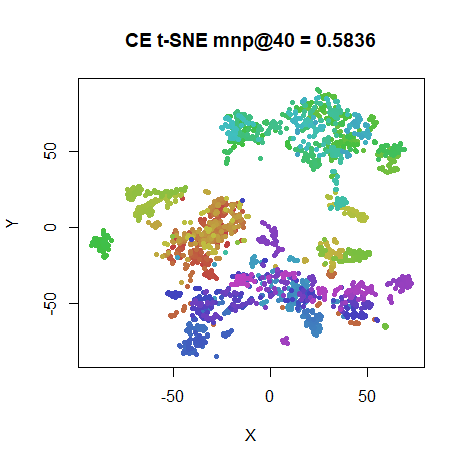
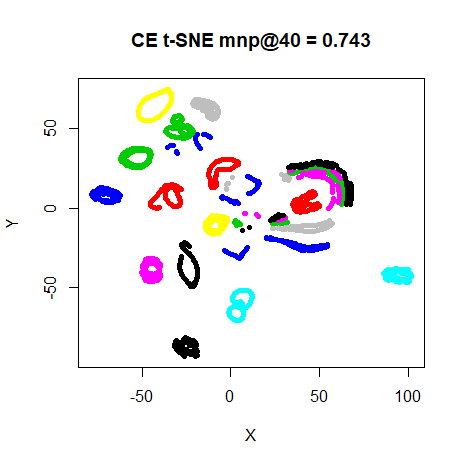
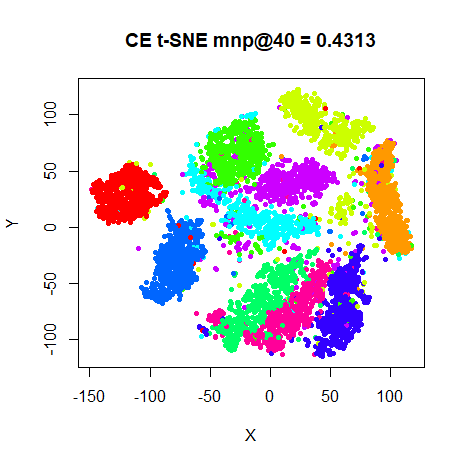
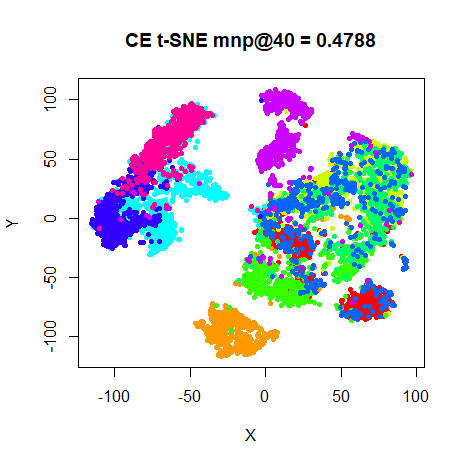
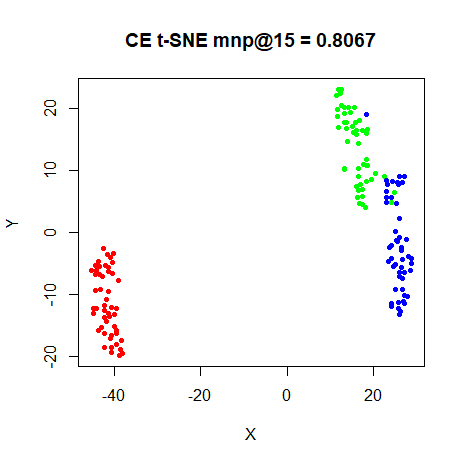
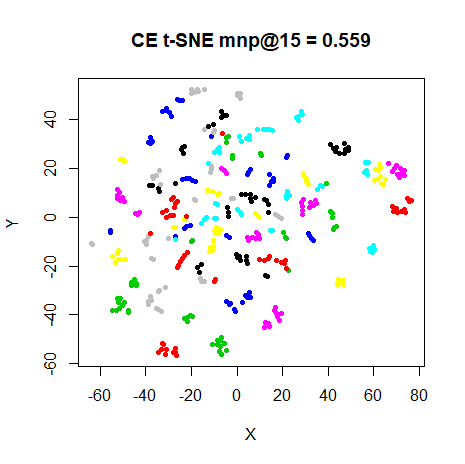
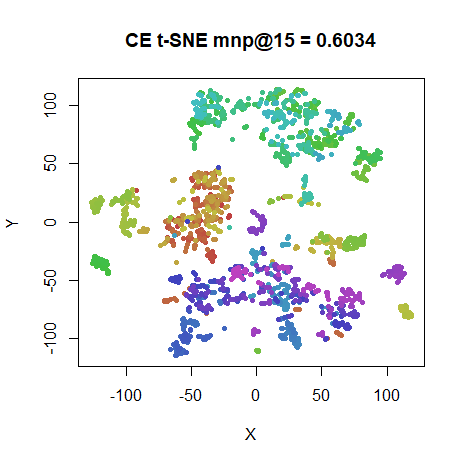
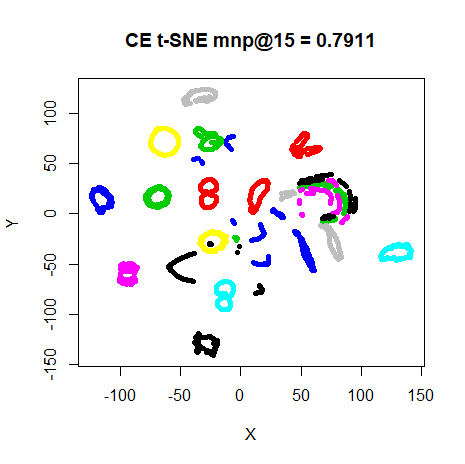
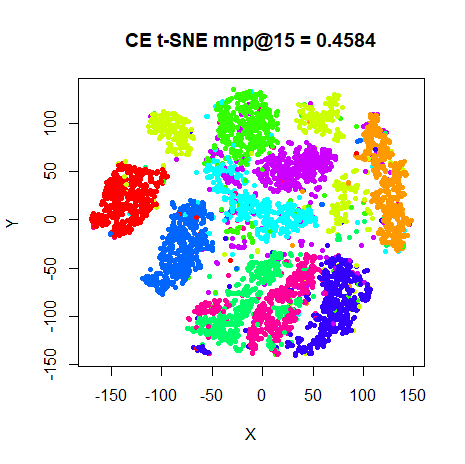
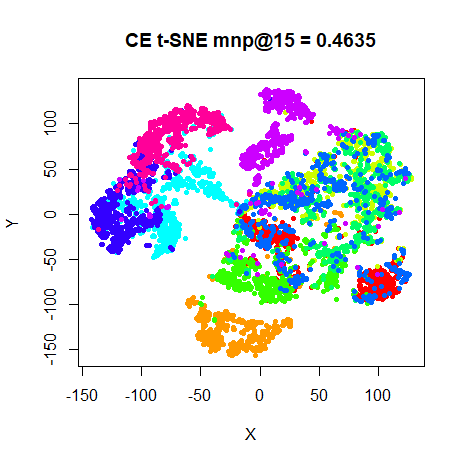
0.001to0.1to the denominator of the resulting gradient to both avoid division by zero and to avoid rather odd-looking results (at least in the waysmallviscalculates the non-stochastic gradient). But when used with SNE (perhaps due to normalization?) I could get away with a much smaller value, which here is1e-10. The default UMAP weight function parameters a = 1.929 and b = 0.7915 were used. - CE t-SNE: The fuzzy set cross-entropy is used instead of the KL divergence. In the way it’s defined by UMAP, this adds an extra non-constant term to the cost function.
- UMAP also uses a normalized Laplacian for initialization, but as discussed under t-SNE initialization, this gives very similar results to using Laplacian Eigenmaps, which in turn doesn’t give very different results on most datasets to just using the scaled PCA result, so we won’t pursue that further here.
Datasets
See the Datasets page.
Settings
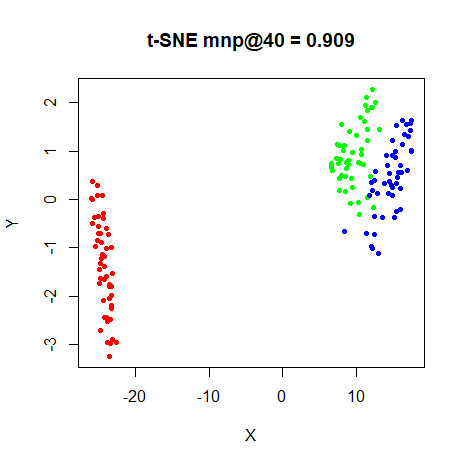
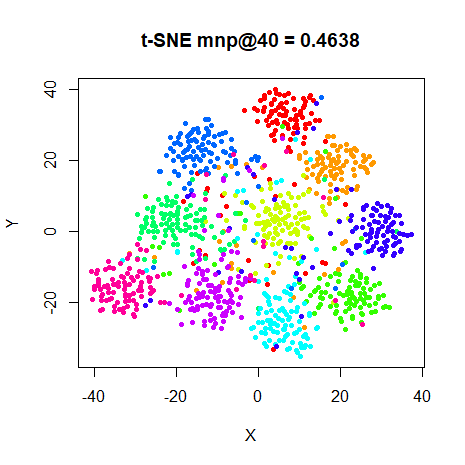
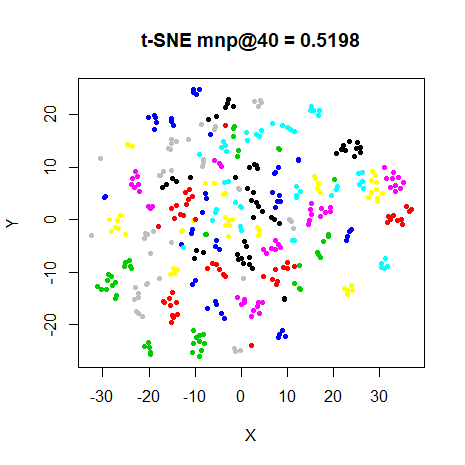
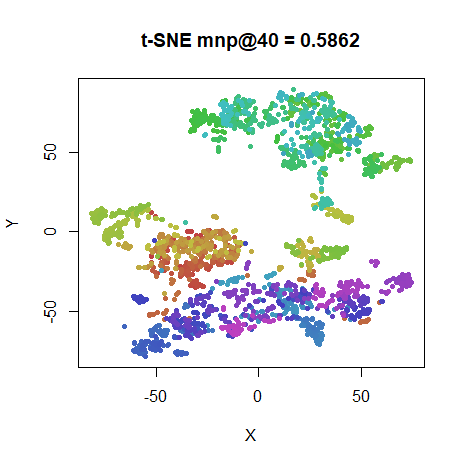
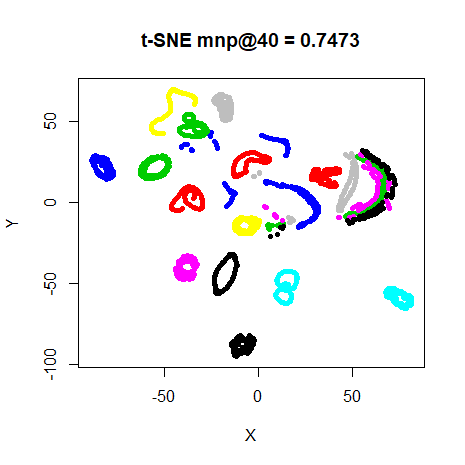
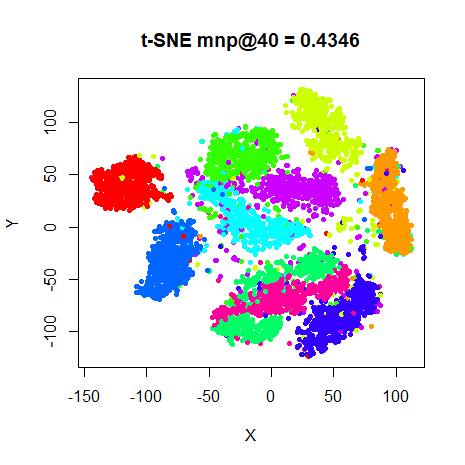
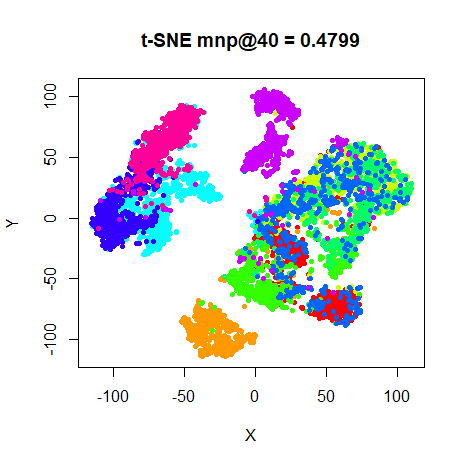
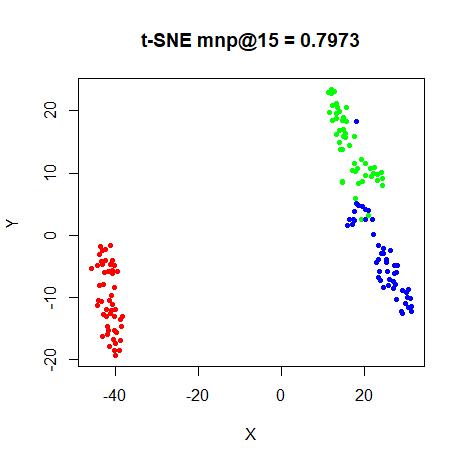
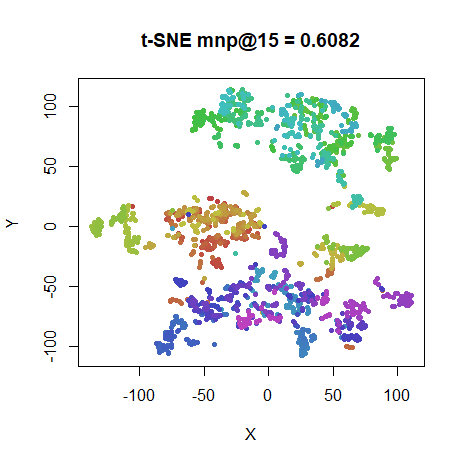
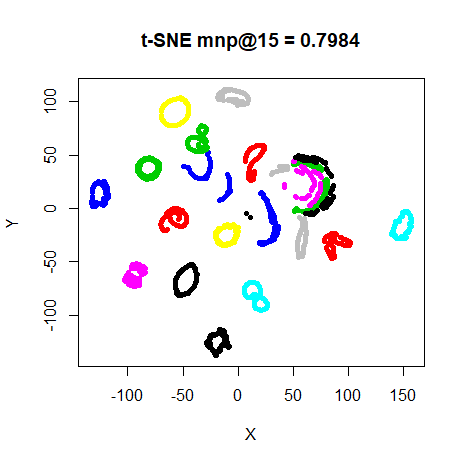
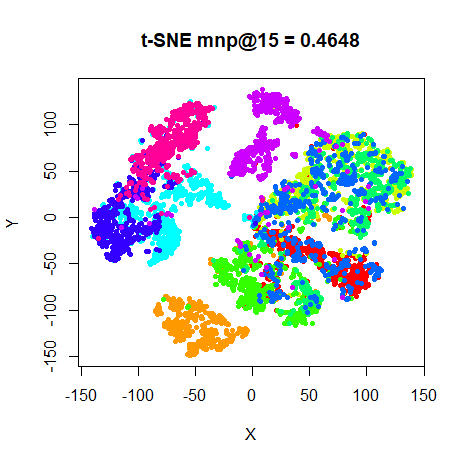
For settings, we’ll use two sets. First, the ones given in the original t-SNE paper, except instead of random initialization, we’ll use the scaled PCA approach. Also, I’ve doubled the number of iterations allowed from 1000 to 2000 to avoid any problems with convergence with these new methods. We’ll also generate t-SNE results to compare with these variations.
For the second set of results, I’ll set the perplexity to 15, which is closer to the UMAP defaults.
iris_usne <- smallvis(
  iris,
  scale = FALSE,
  perplexity = 40,
  Y_init = "spca",
  method = list("usne", gr_eps = 1e-10),
  eta = 100,
  exaggeration_factor = 4,
  stop_lying_iter = 50,
  max_iter = 2000,
  epoch = 50,
  tol = 1e-5
)

iris_skdtsne <- smallvis(
  iris,
  scale = FALSE,
  perplexity = 40,
  Y_init = "spca",
  method = "skdtsne",
  eta = 100,
  exaggeration_factor = 4,
  stop_lying_iter = 50,
  max_iter = 2000,
  epoch = 50,
  tol = 1e-5
)

iris_cetsne <- smallvis(
  iris,
  scale = FALSE,
  perplexity = 40,
  Y_init = "spca",
  method = "cetsne",
  eta = 100,
  exaggeration_factor = 4,
  stop_lying_iter = 50,
  max_iter = 2000,
  epoch = 50,
  tol = 1e-5
)

iris_tsne <- smallvis(
  iris,
  scale = FALSE,
  perplexity = 40,
  Y_init = "spca",
  method = "tsne",
  eta = 100,
  exaggeration_factor = 4,
  stop_lying_iter = 50,
  max_iter = 2000,
  epoch = 50,
  tol = 1e-5
)
Evaluation
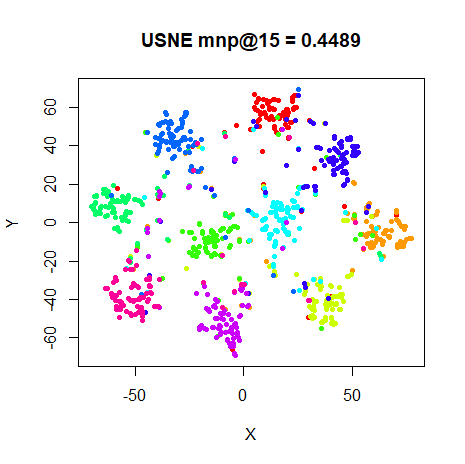
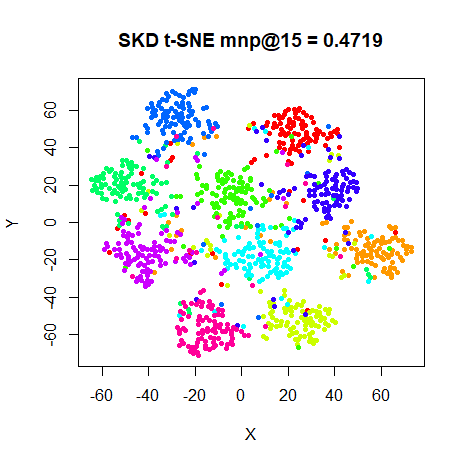
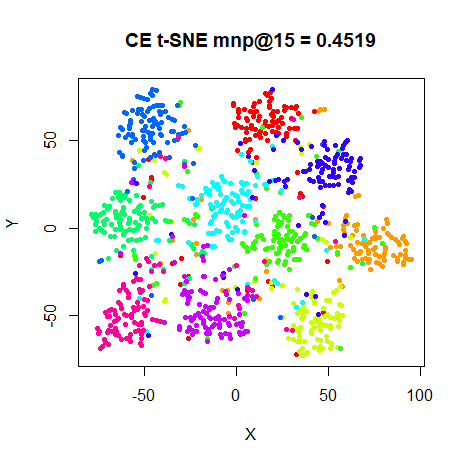
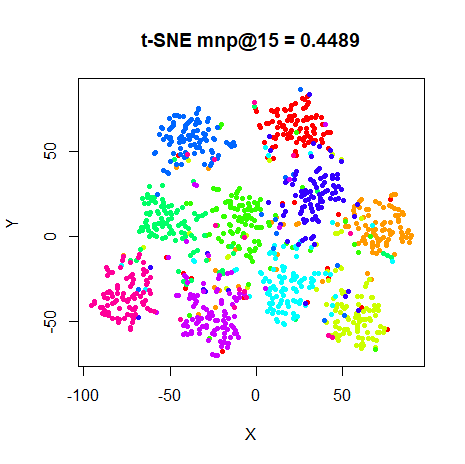
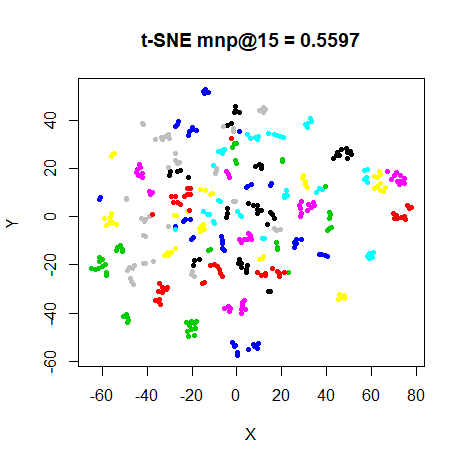
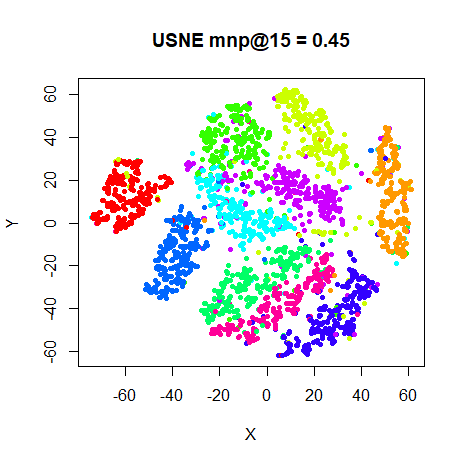
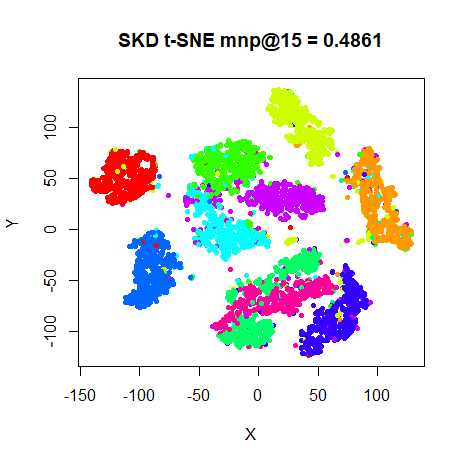
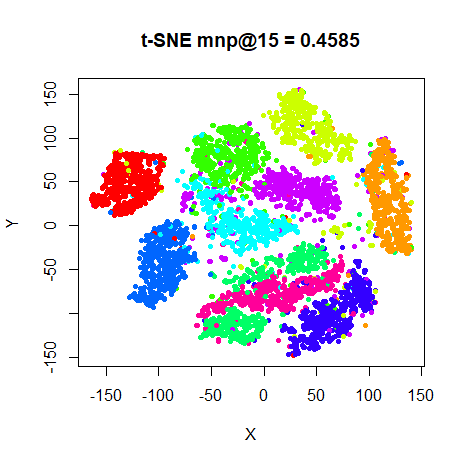
Apart from visualizing the results, the mean neighbor preservation of
the k closest neighbors is used to provide a rough quantification of the
quality of the result. For the first set of results, with perplexity =
40, k = 40 and is labelled as mnp@40. The second set of
results with perplexity = 15, k = 15 and is labelled as
mnp@15.
Fuzzy symmetrization vs smooth knn distances
April 22 2020: This is an expanded version of a discussion of smooth knn distances vs the knn kernel that originally appeared in the conclusions.
The smoothed k-nearest neighbor distances kernel is quite interesting
as an alternative to the gaussian kernel, producing slightly smaller,
more well-separated clusters (compare the fashion6k and
mnist dataset with “t-SNE” and “SKD t-SNE”). This might be
due to the fact that the input weights are set to zero outside the
k-nearest neighbors. There’s also the possibility that the fuzzy set
union approach to symmetrization used by UMAP is having some effect.
I have updated smallvis to make the smooth knn distances
calculation an option for inp_kernel
(inp_kernel = "skd"), and the fuzzy set union process a
symmetrization option symmetrize = "fuzzy", so these two
contributions can be separated.
To get to the bottom of what (if any) effect this settings have on
t-SNE, here are some results, using all six combinations of
inp_kernel set to "gauss" (the t-SNE default),
"knn", or "skd" (smooth knn distances, as used
by UMAP) and symmetrize set to "average" (the
default t-SNE approach that takes the mean average of v_{ij} and v_{ji}) and "fuzzy" (the fuzzy
set union used by UMAP).
Other settings are the typical t-SNE settings for smaller datasets:
eta = 100, exaggeration_factor = 4 and my usual
initialization default of scaled PCA. An example of this for
iris, showing how to use non-default
inp_kernel and symmetrize values with
perplexity = 40:
iris_skd_fuzzy <- smallvis(
  method = list("tsne", inp_kernel = "skd", symmetrize = "fuzzy"),
  perplexity = 40,
  exaggeration_factor = 4,
  Y_init = "spca",
  eta = 100
)
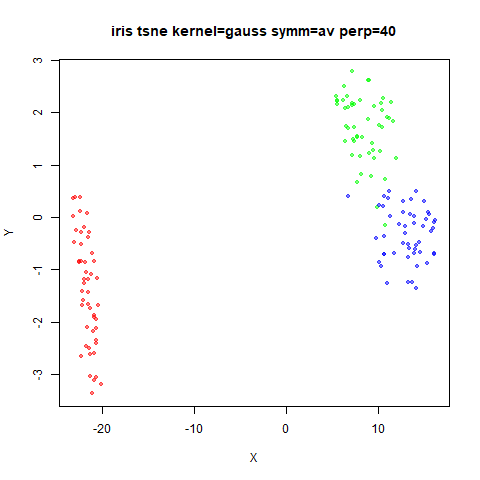
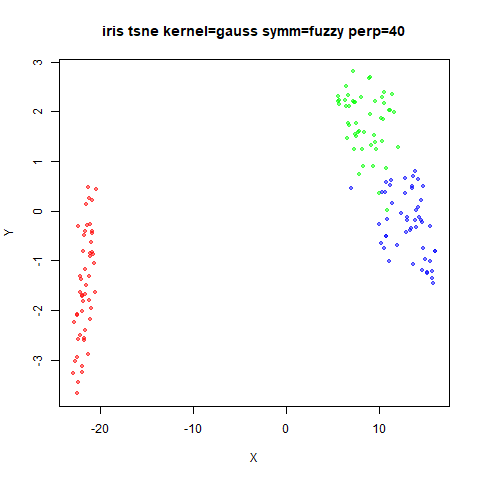
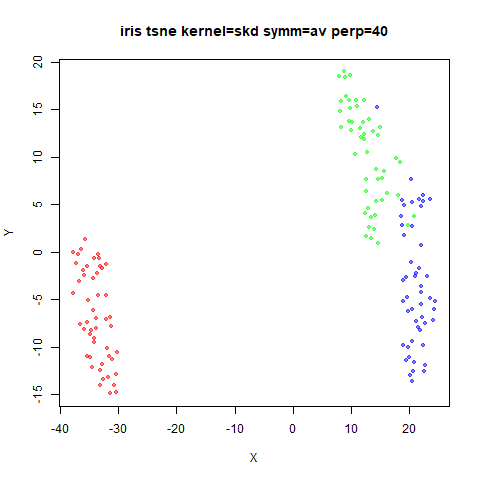
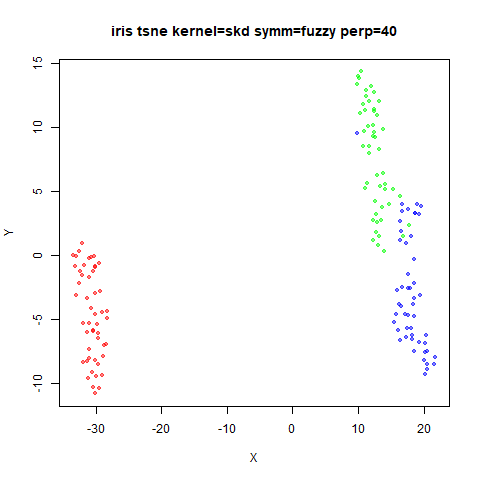
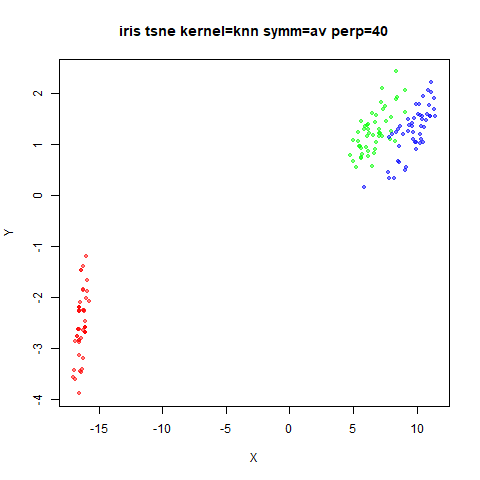
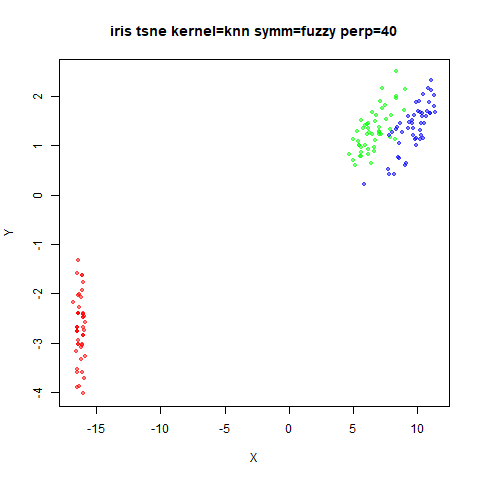
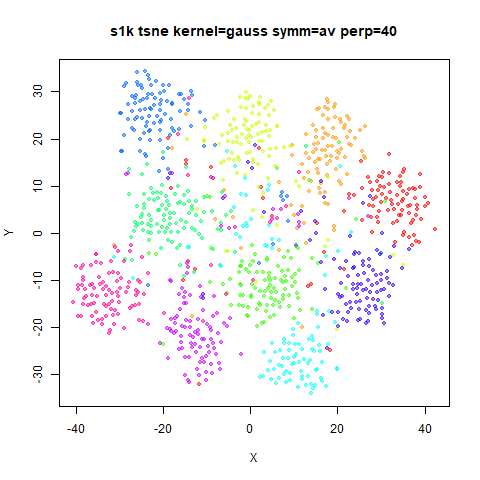
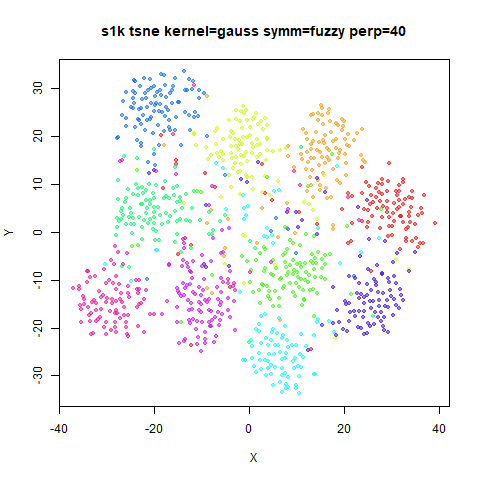
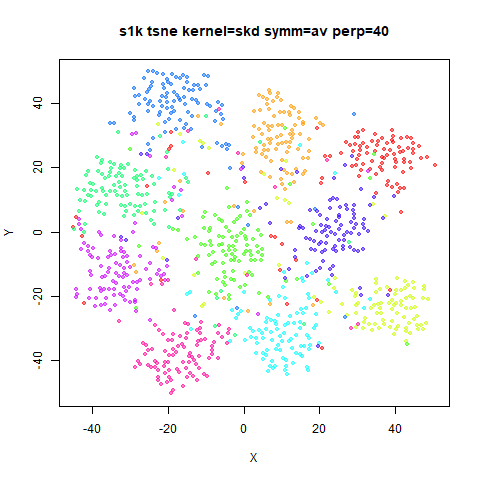
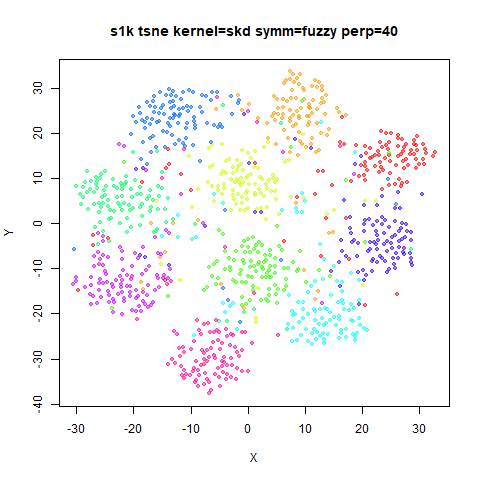
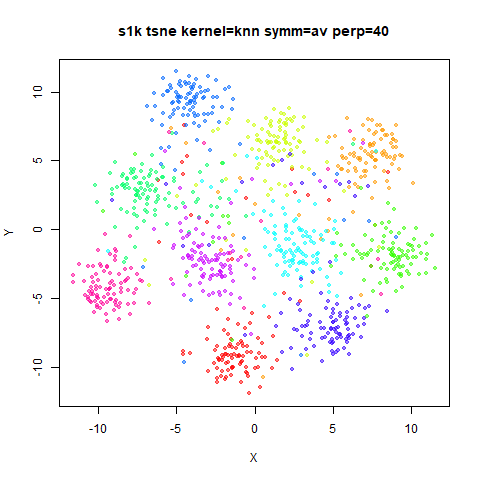
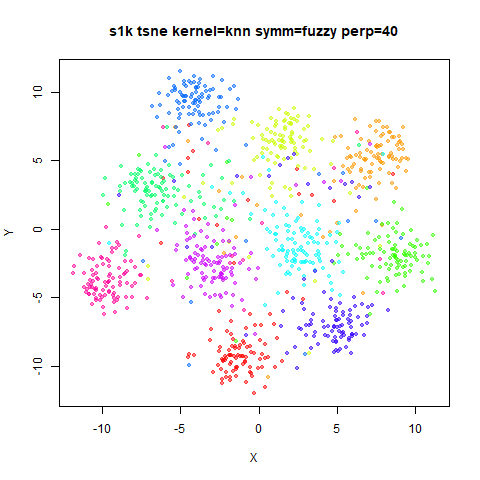
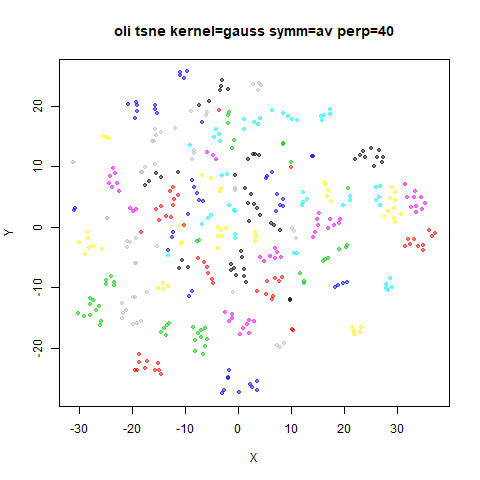
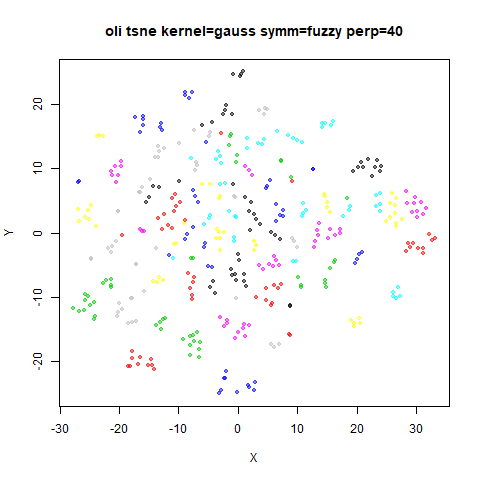
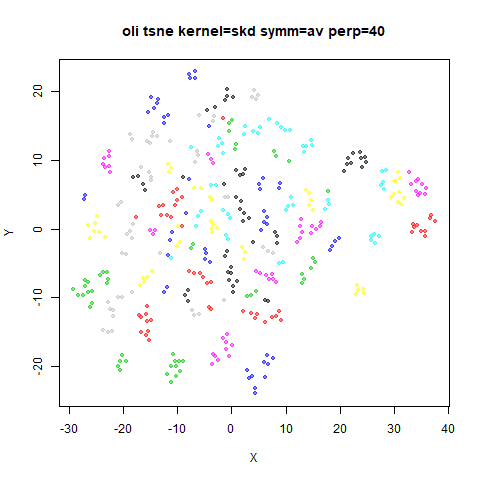
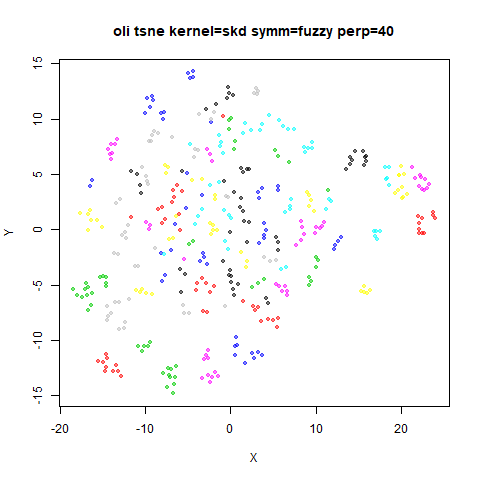
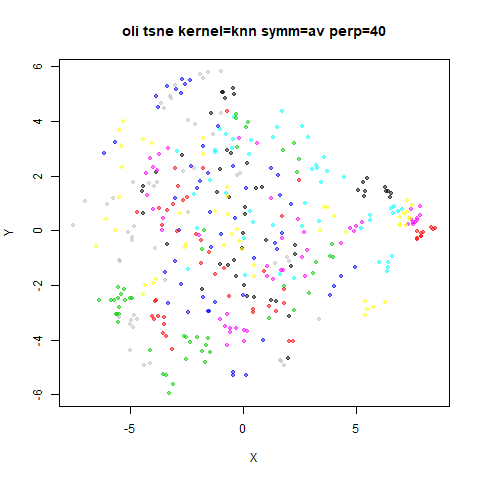
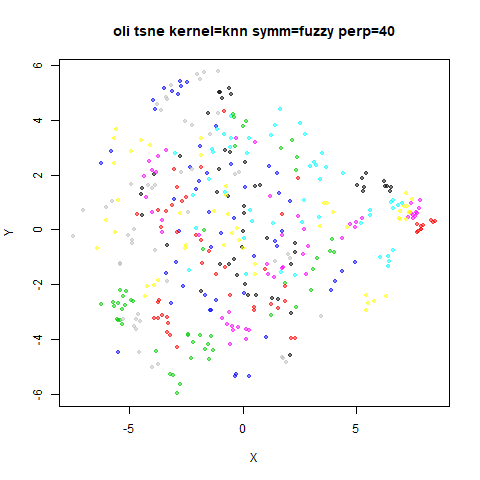
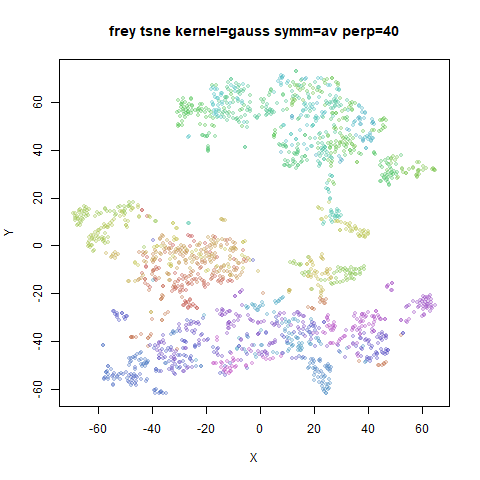
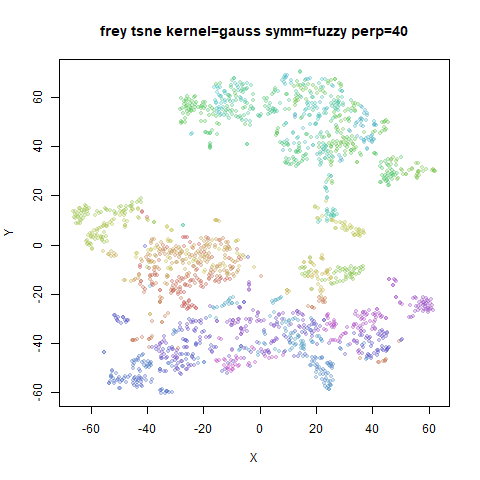
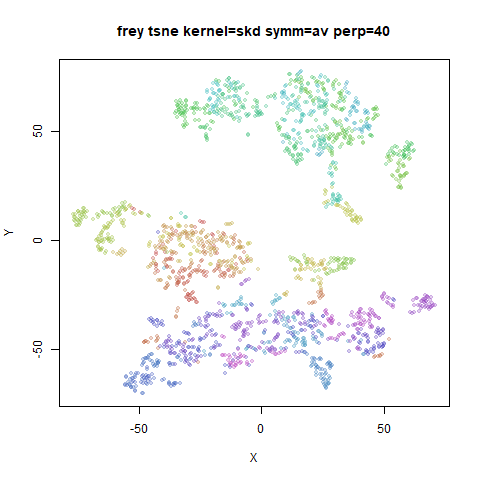
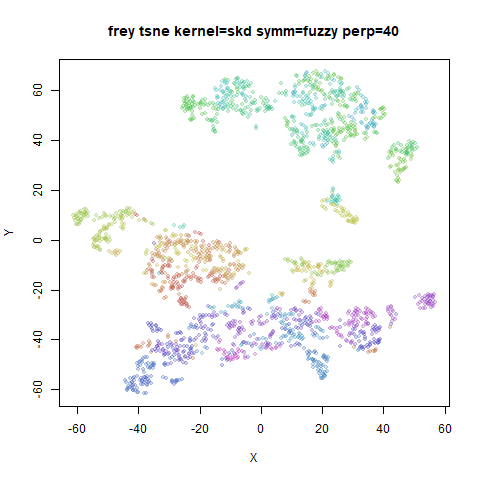
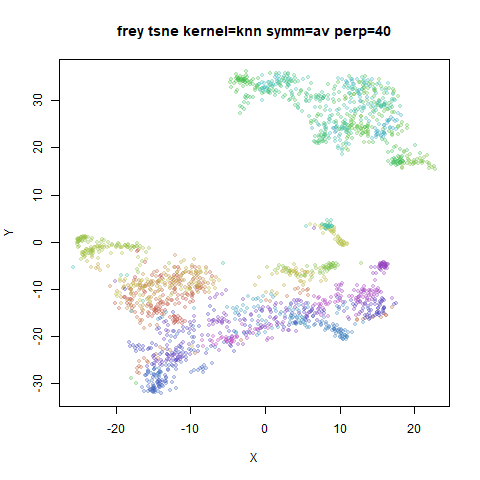
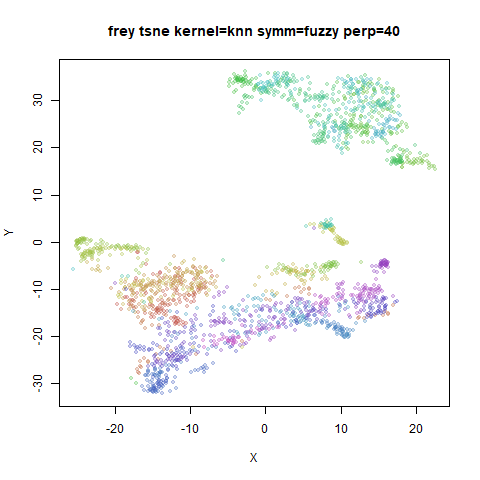
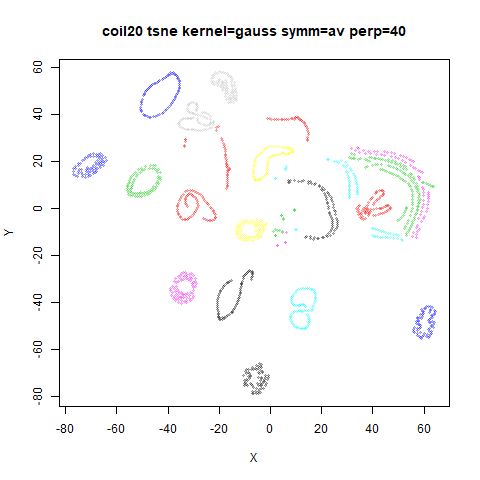
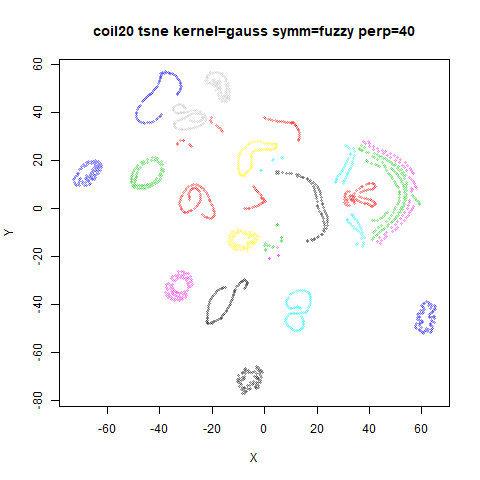
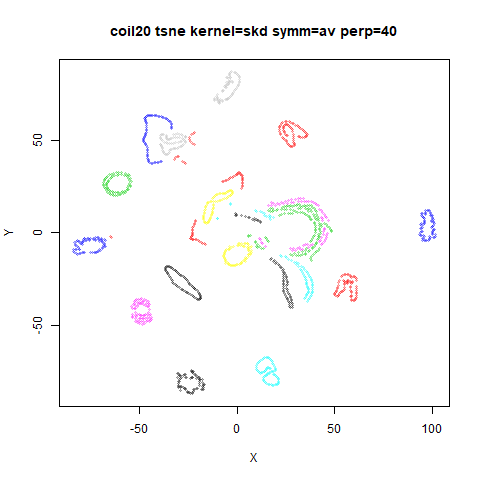
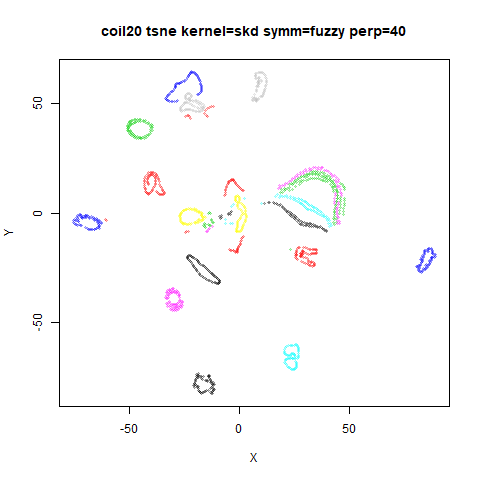
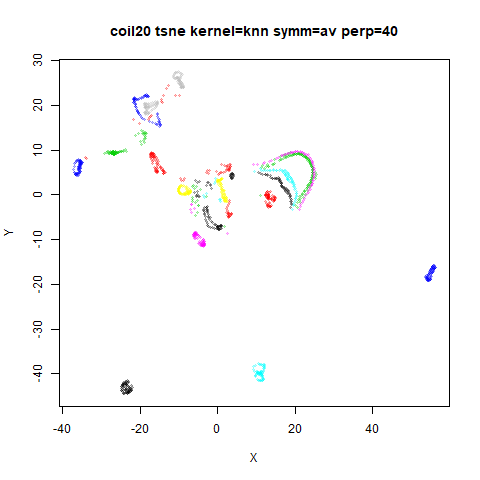
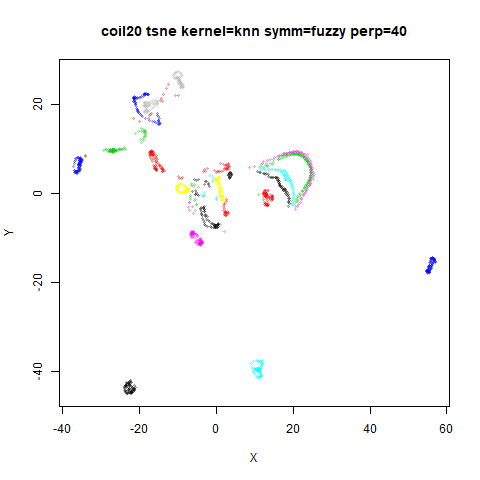
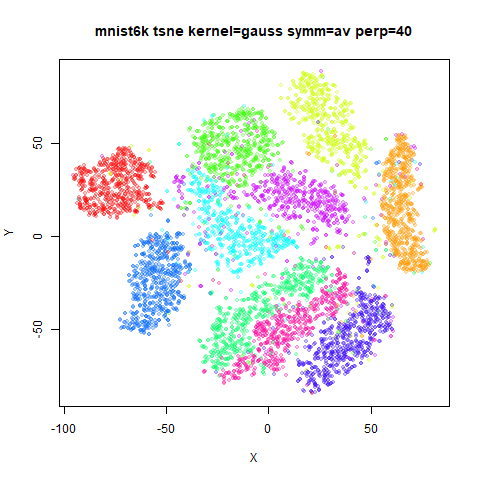
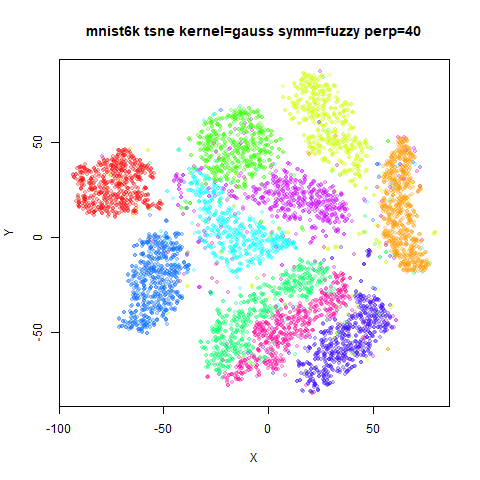
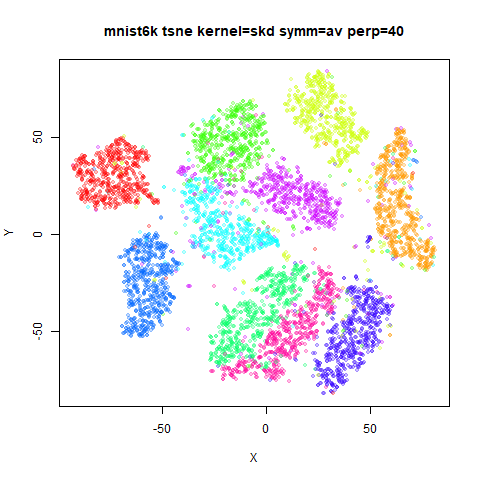
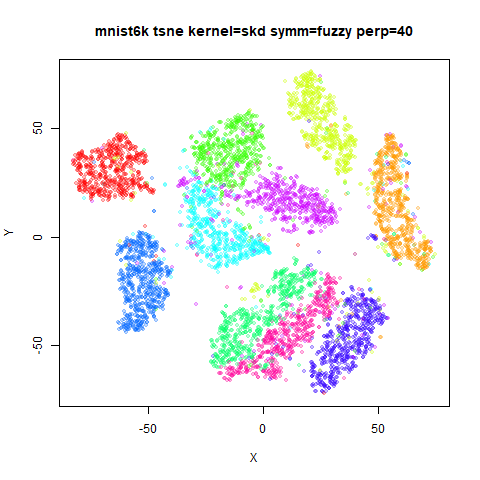
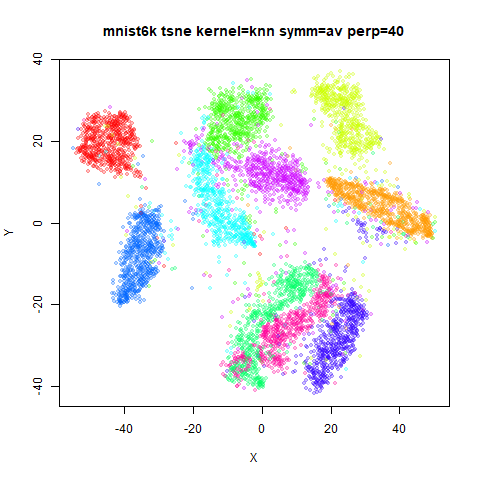
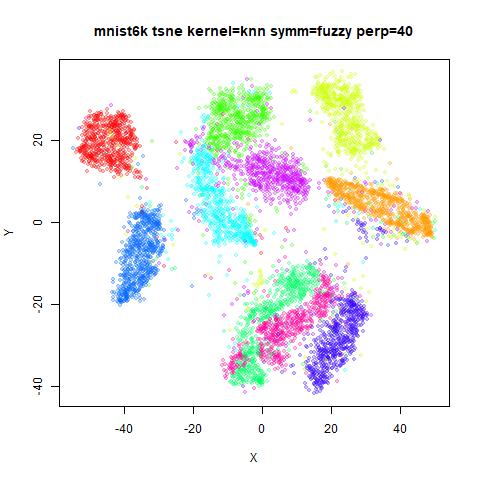
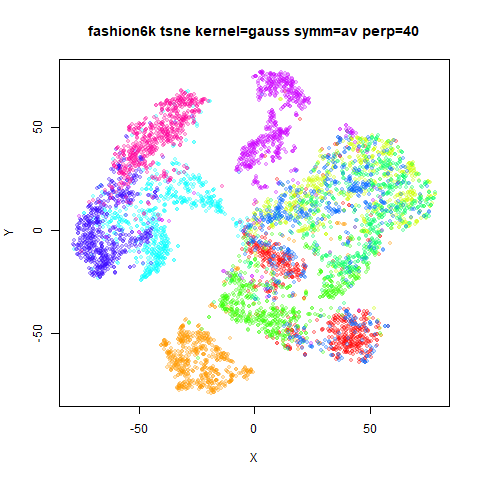
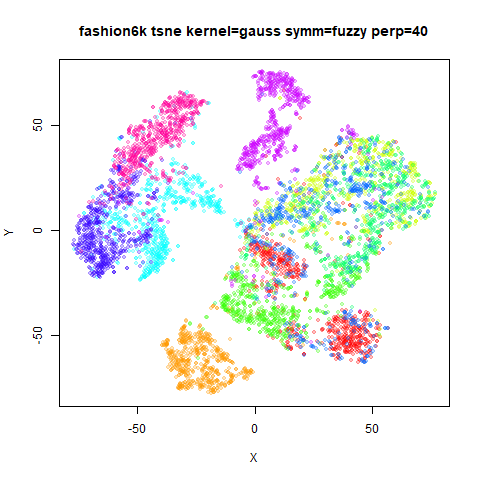
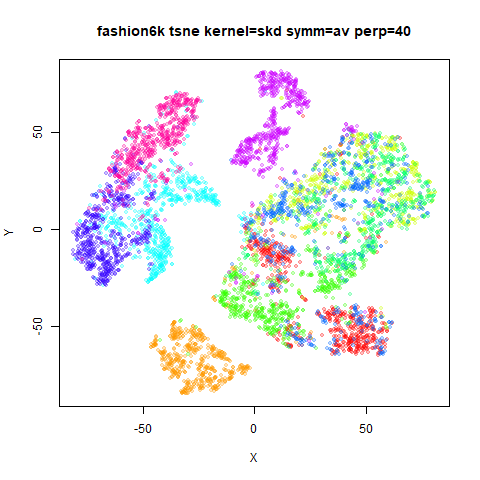
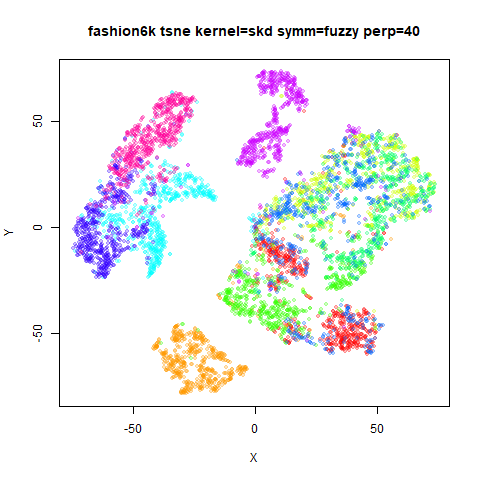
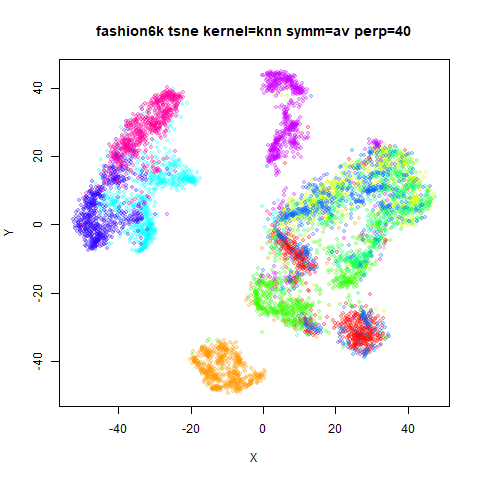
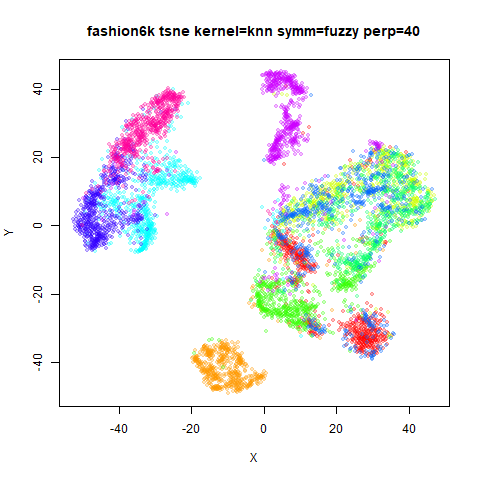
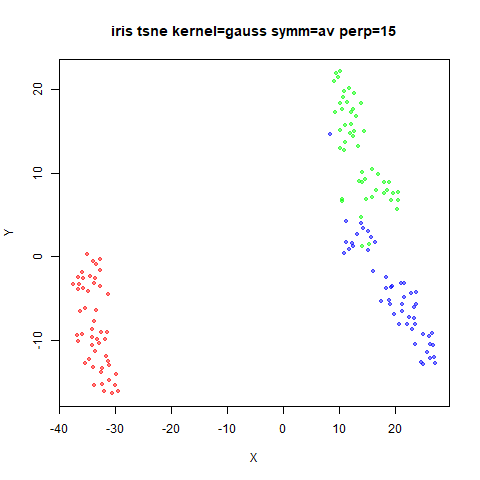
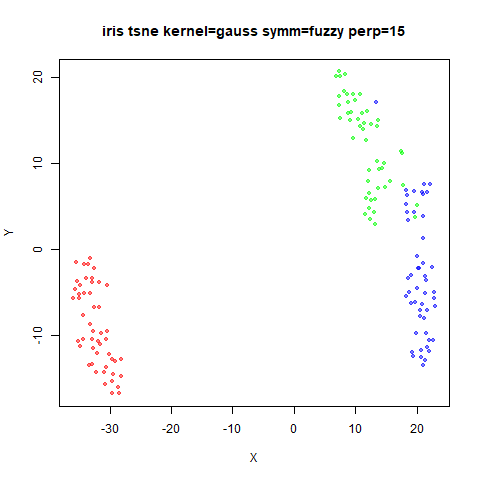
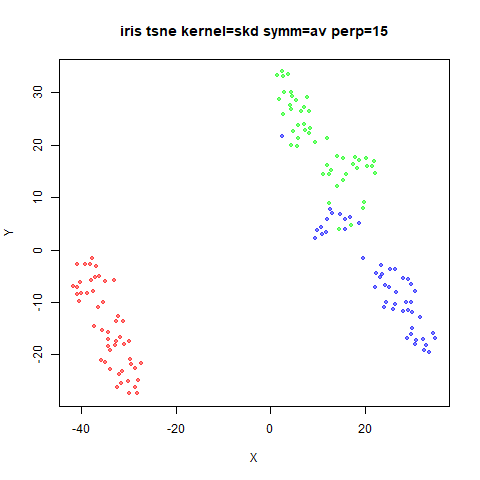
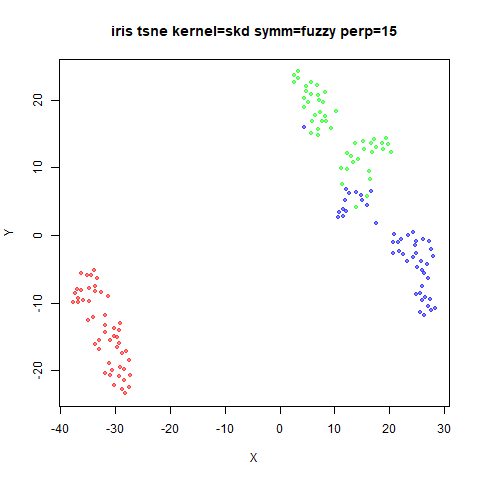
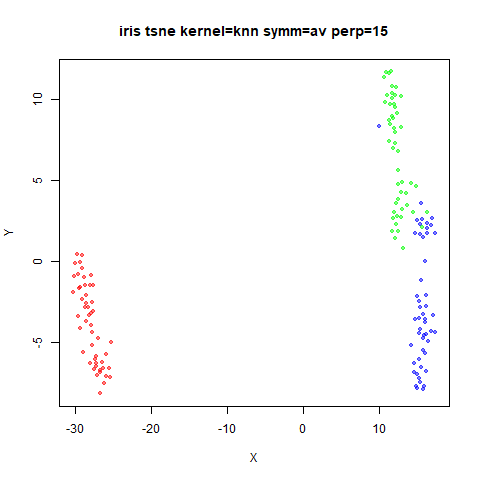
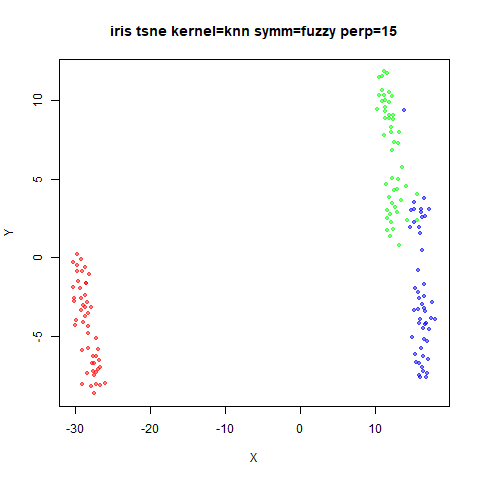
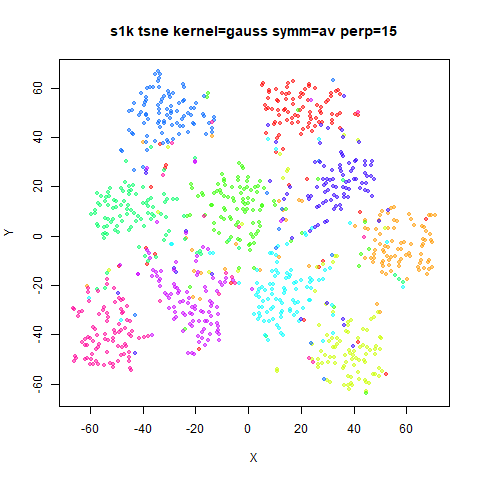
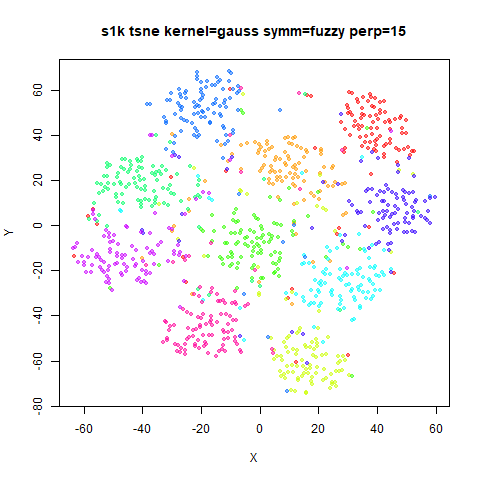
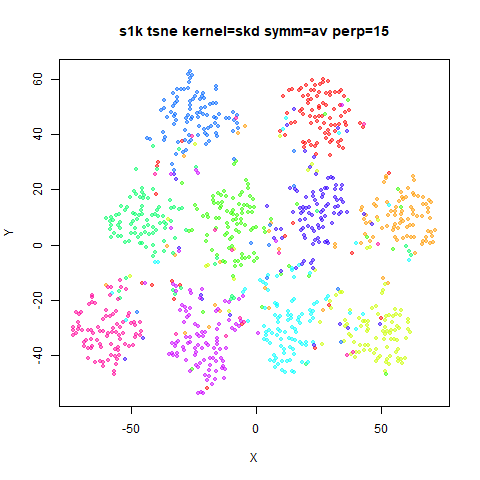
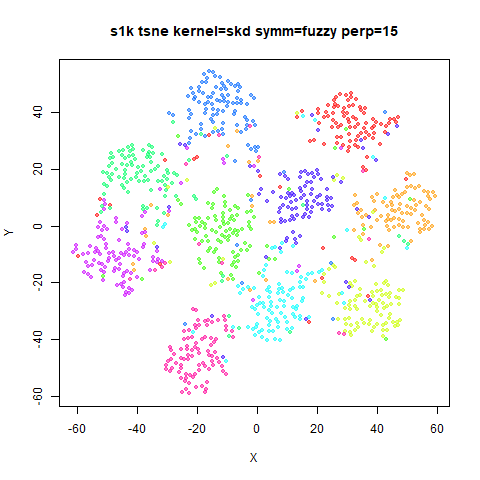
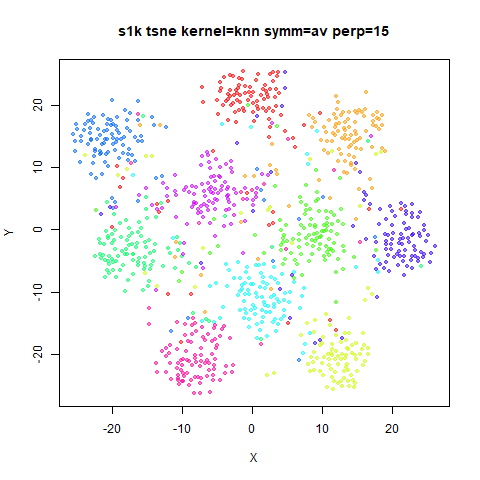
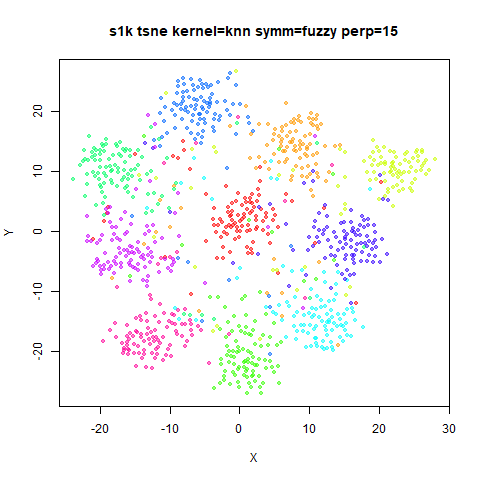
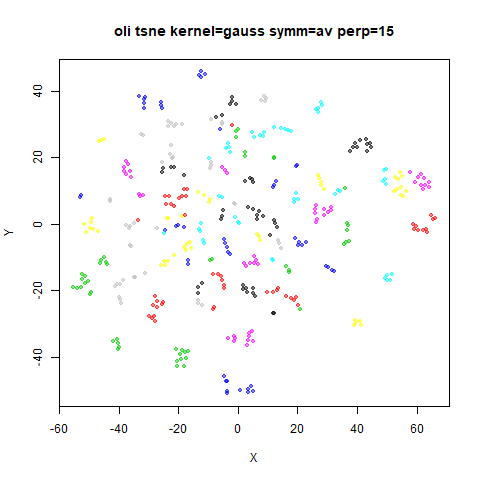
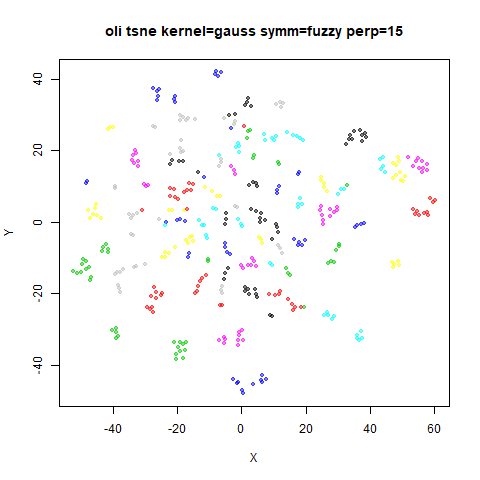
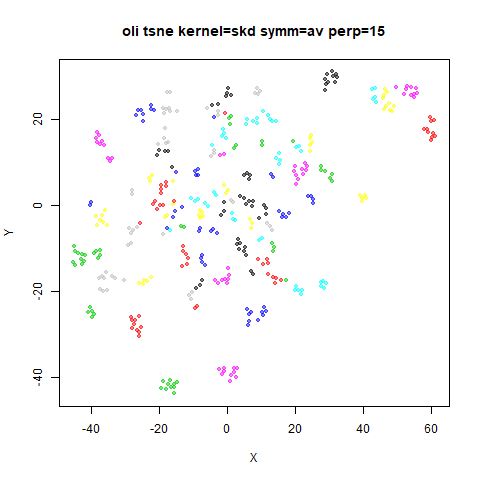
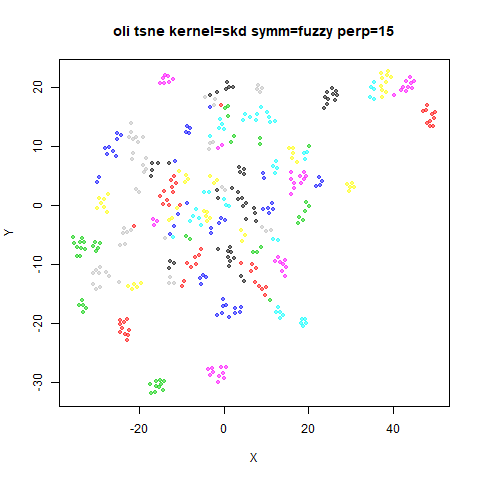
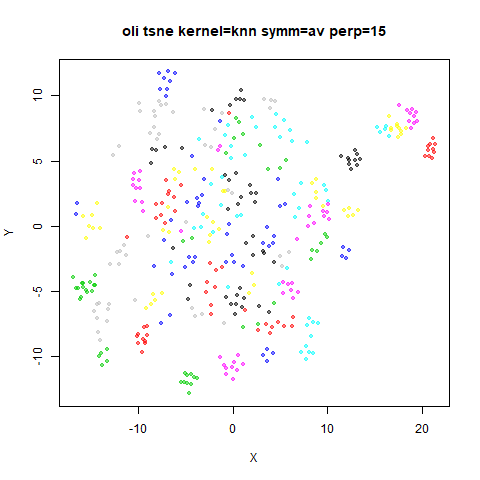
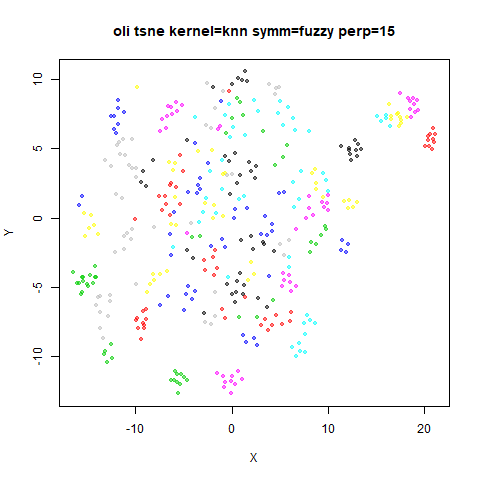
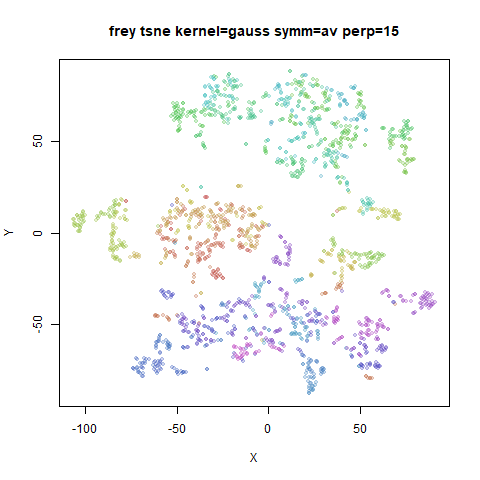
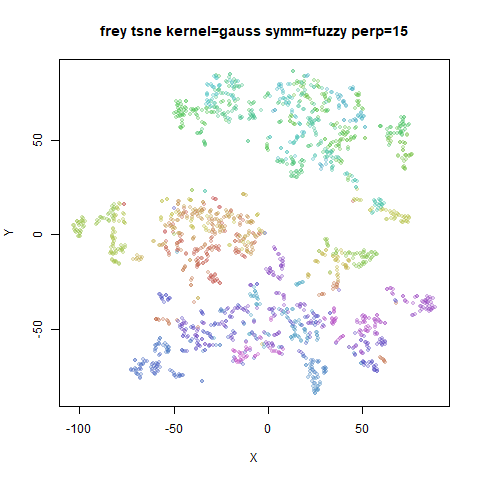
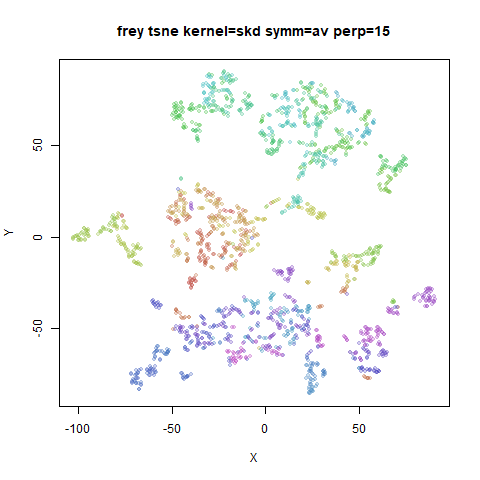
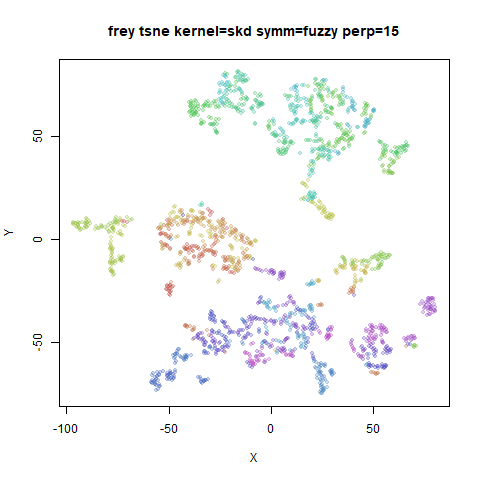
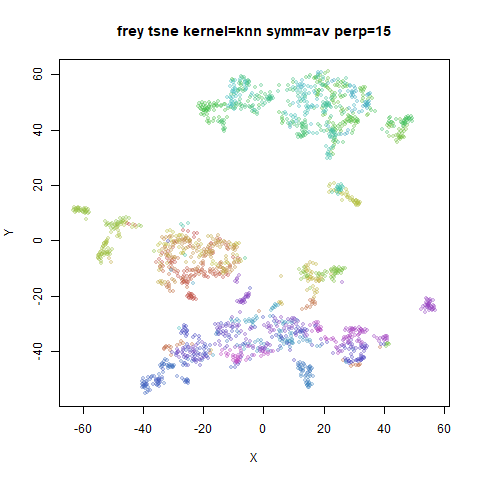
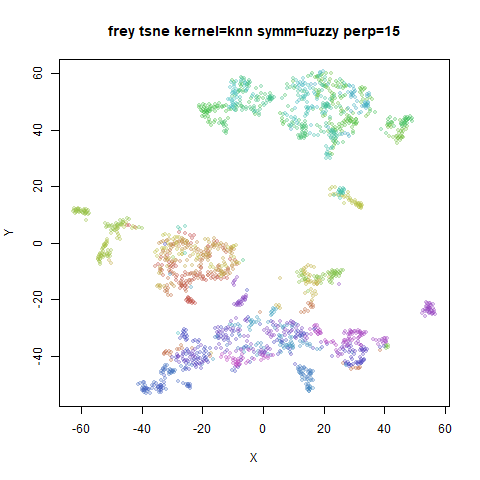
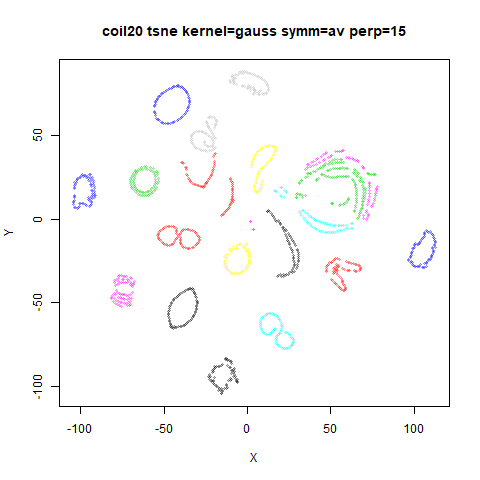
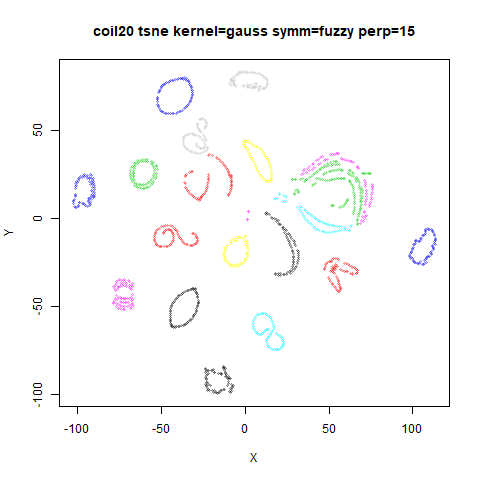
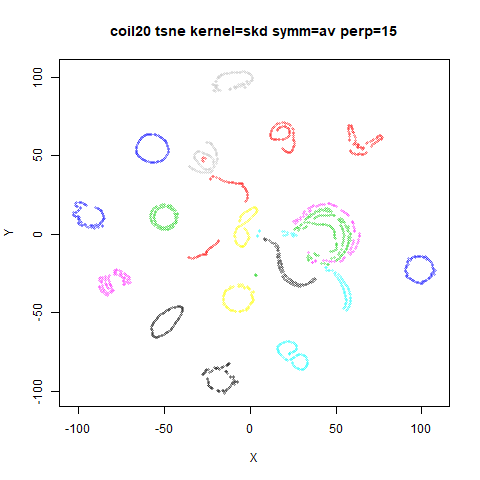
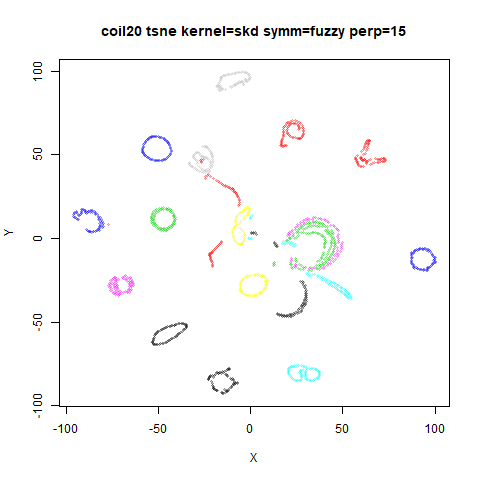
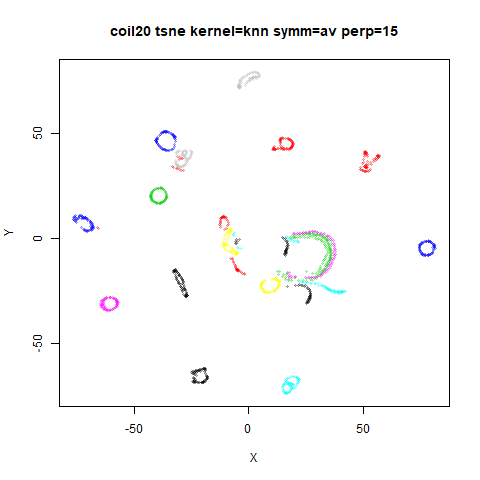
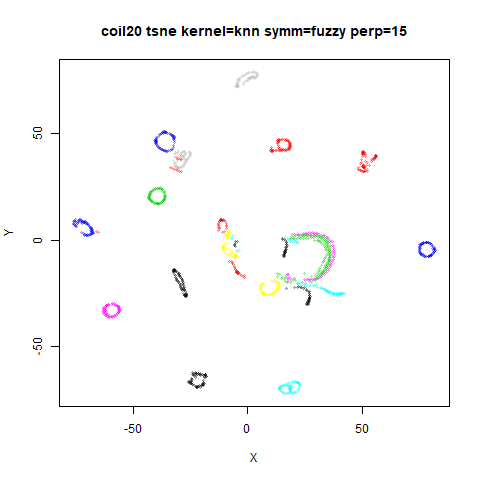
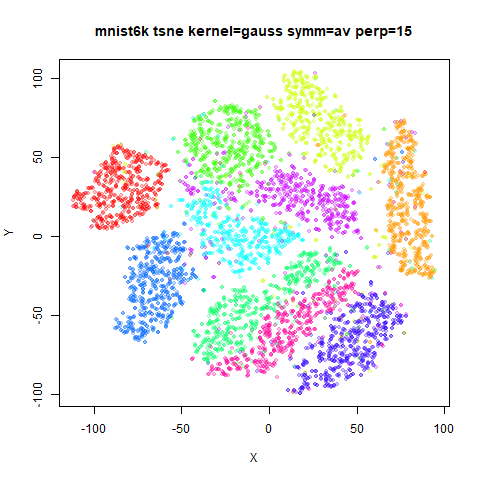
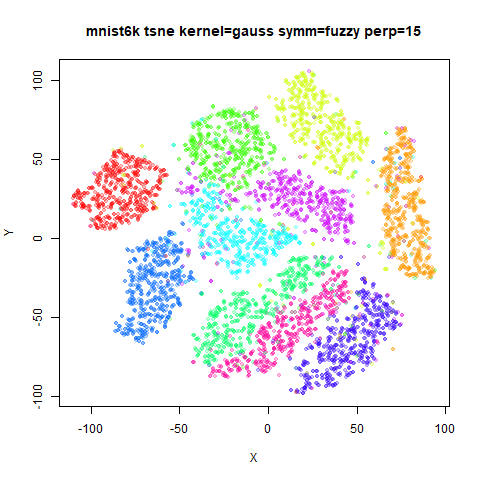
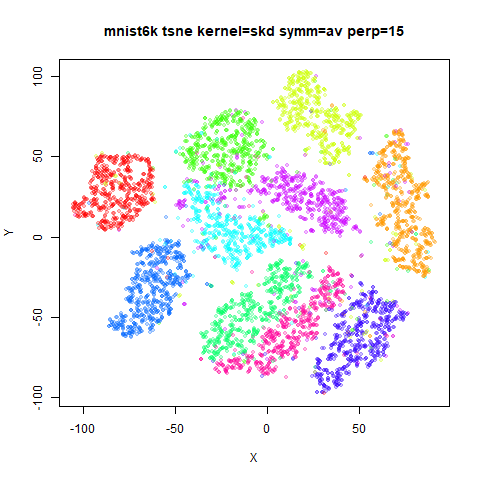
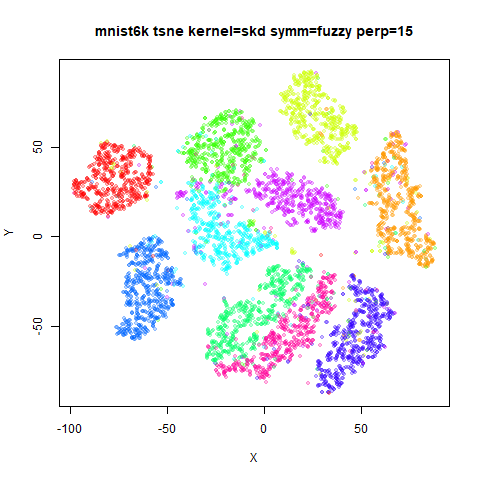
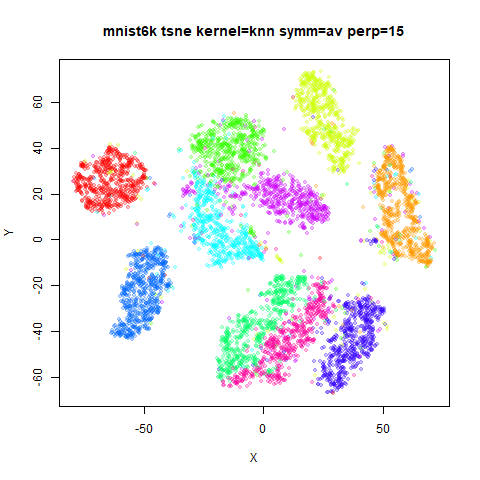
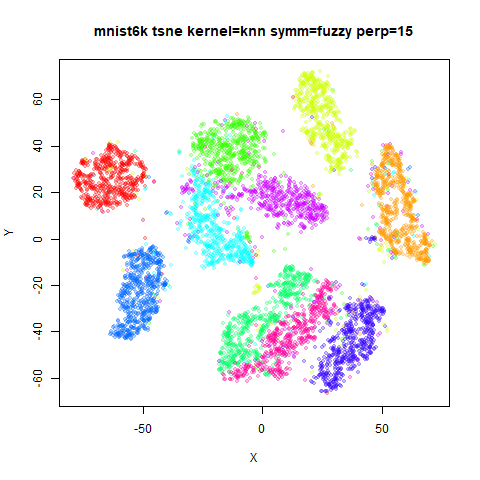
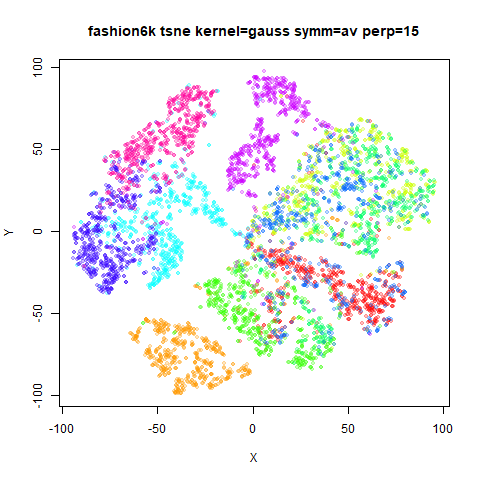
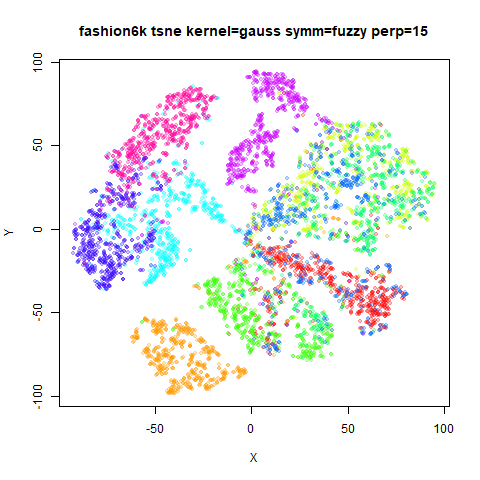
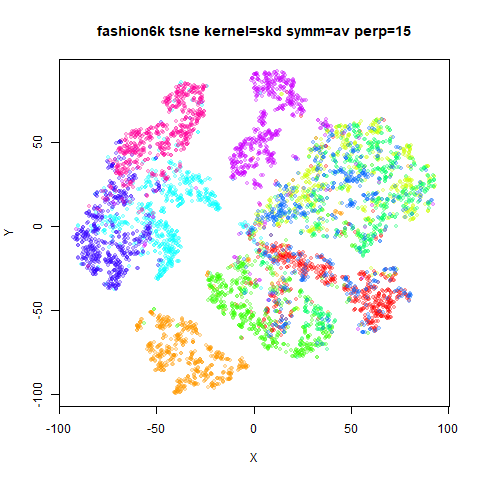
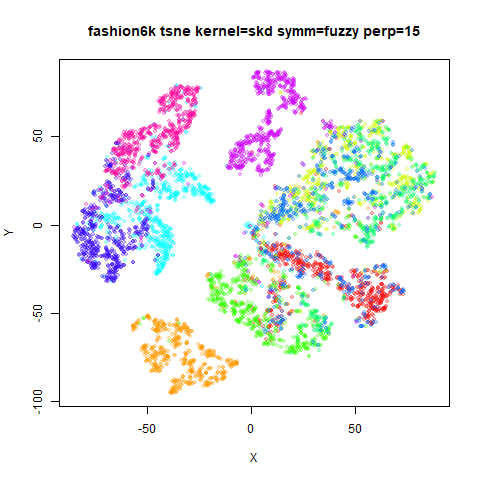
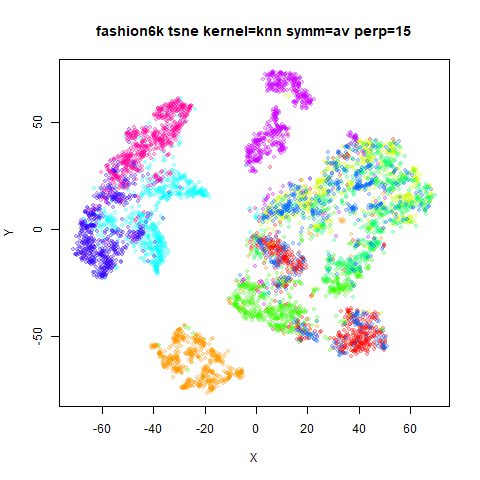
In the results below, the first row shows results from using the standard t-SNE Gaussian input kernel. The second row uses the smooth knn distances kernel. The third row uses the knn kernel.
On the left are results with the standard symmetrization, on the right using the fuzzy set union symmetrization.
The top left and middle right images should be comparable with the t-SNE and skd t-SNE results, respectively.
Results are shown for perplexity 40 and then perplexity 15.
Kernel + Symmetrization Results: Perplexity 15
fashion6k
 |
 |
 |
 |
 |
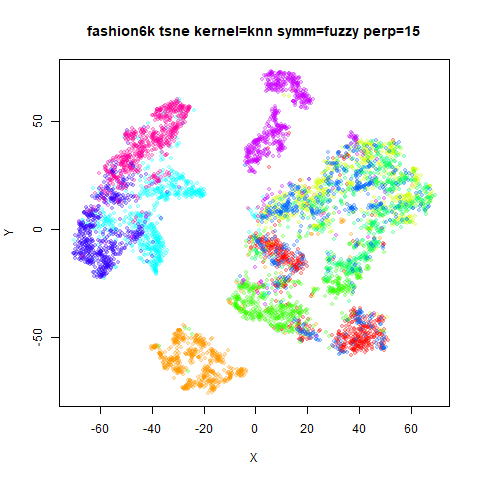 |
These results show that the symmetrization has only a very minor
effect on the visualization. If you look very closely, you can see that
the skd kernel shows the biggest difference in combination
with fuzzy set union: there is a slightly larger separations of clusters
(most easily seen with frey, mnist6k and
fashion6k). For the other settings the difference is
exceptionally minor.
The bigger differences are down to the choice of the input kernel. The knn kernel gives the smallest, most spread-out clusters, and the Gaussian kernel the least. The smooth knn distances is in between the two. Having the affinities set to zero outside a small number of close neighbors would seem to drive this manifestation, presumably because the small attractive interactions that exist for points outside the closest neighbors do add up to have an effect. The smooth knn distances kernel also seems to retain more of the fine structure found with the Gaussian kernel, presumably because the exponential weighting is closer to the Gaussian than the step function used with the knn kernel.
Conclusions
None of these changes have very much effect on t-SNE. The biggest effect is by using the UMAP output kernel, but the overall shape of the embedding is unaffected with the default kernel settings. It also noticeably increases the computational time due to the more complex gradient, so unless you really like the more compressed clusters, t-SNE still wins out here.
In terms of input affinities, it’s clear that the fuzzy set union symmetrization does not make a big difference. The smooth knn distances kernel does have an effect though: it creates slightly smaller more separated clusters, and this is probably due to the sparsifying of the input affinities, because the effect is even more pronounced for the knn kernel.
Obviously, these results don’t provide any reason to believe that t-SNE implementations would benefit from calculating input affinities the UMAP way. UMAP is able to construct a theoretical foundation for why input affinities should be generated using smooth knn distances and symmetrized by fuzzy set union, rooted in topology and fuzzy sets, whereas the t-SNE approach has never had a of a theoeretical justification (that I am aware of). Practically, though, it doesn’t make much of a difference for t-SNE.
However, these results don’t tell us if UMAP would be changed by adopting t-SNE-style affinity calculations, because the lack of matrix normalization in UMAP might allow for larger differences in perplexity-calibration versus smooth knn distances to emerge. There’s good reason to believe that there could in principle be some differences, because although UMAP affinities are row-normalized, they are normalized to \log_2 k where k is the number of nearest neighbors (analogous to perplexity), which is always going to be larger than 1 for any sensible choice of k.